HOT TOPICS LIST
- MACD
- Fibonacci
- RSI
- Gann
- ADXR
- Stochastics
- Volume
- Triangles
- Futures
- Cycles
- Volatility
- ZIGZAG
- MESA
- Retracement
- Aroon
INDICATORS LIST
LIST OF TOPICS
PRINT THIS ARTICLE
by Chaitali Mohile
After a bullish breakout, Braskem is regaining strength to hit resistance. Cautious trading is essential.
Position: Buy
Chaitali Mohile
Active trader in the Indian stock markets since 2003 and a full-time writer. Trading is largely based upon technical analysis.
PRINT THIS ARTICLE
BREAKOUTS
Braskem Hitting Previous High
08/20/10 10:20:15 AMby Chaitali Mohile
After a bullish breakout, Braskem is regaining strength to hit resistance. Cautious trading is essential.
Position: Buy
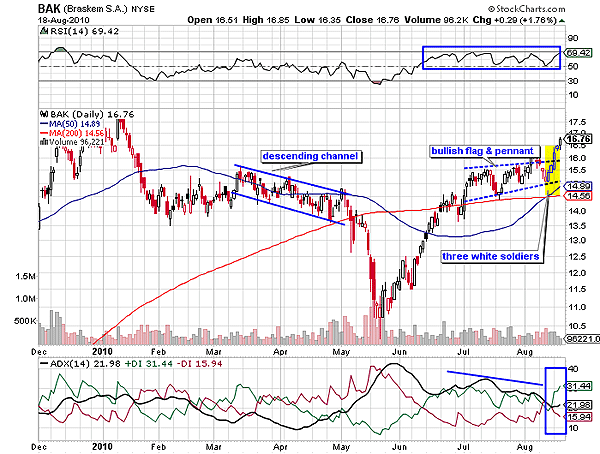
| Braskem S.A. (BAK) witnessed a very short-term correction from $15 to $10.50 that lasted for about two months. Before the nosedive from $14, the stock moved in a narrow descending channel with the support/resistance of the 50-day and 200-day moving averages (MA). The advance rally violated the MA resistance and inched higher. The earlier descending channel developed a robust resistance for the current rally, and BAK consolidated in this area. The sideways price action afterward formed a bullish flag & pennant formation on the daily time frame in Figure 1. |
| The flag & pennant is a bullish continuous pattern in an existing uptrend. During the rally, the average directional index (ADX) (14) in Figure 1 plunged from an overheated downtrend region to a developing bullish trend area. Although the ADX line (black) was shaky between 25 and 30 levels, the uptrend remain unharmed. Currently, the trend indicator is indicating a developing uptrend. The pattern broke upward and is ready to resume the prior advance rally. The breakout occurred on highly bullish notes as a three white soldiers candlestick pattern formed on the price chart. Observe the three consecutive white candles that have closed at the new intraday highs, while the second and third candles have opened near the previous day's close. |

|
| FIGURE 1: BAK, DAILY. The bullish flag & pennant pattern has broken upward with the target of $20. |
| Graphic provided by: StockCharts.com. |
| |
| This candlestick pattern is a bullish trend reversal. The descending uptrend has stabilized at 20 levels, indicating the developing uptrend. Therefore, the three white soldiers would initiate the robust uptrend in Figure 1. The relative strength index (RSI) (14) was stuck in a bullish area between 50 and 70 levels, indicating stable bullish strength in the rally. Therefore, the breakout rally was successful and hit the minimum estimated levels. To calculate the potential target of the flag & pennant formation in Figure 1, the length of the flagpole, which represents the advance rally, is 4 (14.50 - 10.50) is added to the breakout level at 16. Therefore, $20 is the breakout target for BAK. |
| However, looking back at the chart, you will see that in January 2010 there was resistance at $18.00. This could be the first hurdle for the rally. If BAK slows down near this resistance level, traders may book partial profits close to $18. If the stock continues with momentum above this level, traders can reenter the market with the stock. New long positions can be opened above $18. |
| If BAK breaks out above its resistance at the $18 level, it is likely to move to its breakout target of $20. |
Active trader in the Indian stock markets since 2003 and a full-time writer. Trading is largely based upon technical analysis.
| Company: | Independent |
| Address: | C1/3 Parth Indraprasth Towers. Vastrapur |
| Ahmedabad, Guj 380015 | |
| E-mail address: | chaitalimohile@yahoo.co.in |
Traders' Resource Links | |
| Independent has not added any product or service information to TRADERS' RESOURCE. | |
Click here for more information about our publications!
PRINT THIS ARTICLE

Request Information From Our Sponsors
- VectorVest, Inc.
- Executive Premier Workshop
- One-Day Options Course
- OptionsPro
- Retirement Income Workshop
- Sure-Fire Trading Systems (VectorVest, Inc.)
- Trading as a Business Workshop
- VectorVest 7 EOD
- VectorVest 7 RealTime/IntraDay
- VectorVest AutoTester
- VectorVest Educational Services
- VectorVest OnLine
- VectorVest Options Analyzer
- VectorVest ProGraphics v6.0
- VectorVest ProTrader 7
- VectorVest RealTime Derby Tool
- VectorVest Simulator
- VectorVest Variator
- VectorVest Watchdog
- StockCharts.com, Inc.
- Candle Patterns
- Candlestick Charting Explained
- Intermarket Technical Analysis
- John Murphy on Chart Analysis
- John Murphy's Chart Pattern Recognition
- John Murphy's Market Message
- MurphyExplainsMarketAnalysis-Intermarket Analysis
- MurphyExplainsMarketAnalysis-Visual Analysis
- StockCharts.com
- Technical Analysis of the Financial Markets
- The Visual Investor
