HOT TOPICS LIST
- MACD
- Fibonacci
- RSI
- Gann
- ADXR
- Stochastics
- Volume
- Triangles
- Futures
- Cycles
- Volatility
- ZIGZAG
- MESA
- Retracement
- Aroon
INDICATORS LIST
LIST OF TOPICS
PRINT THIS ARTICLE
by Chaitali Mohile
It is very difficult to anticipate the breakout in the Financial Select Sector, since even the reliable patterns may misguide.
Position: N/A
Chaitali Mohile
Active trader in the Indian stock markets since 2003 and a full-time writer. Trading is largely based upon technical analysis.
PRINT THIS ARTICLE
CHART ANALYSIS
XLF In Narrow Trading Range
08/19/10 08:28:49 AMby Chaitali Mohile
It is very difficult to anticipate the breakout in the Financial Select Sector, since even the reliable patterns may misguide.
Position: N/A
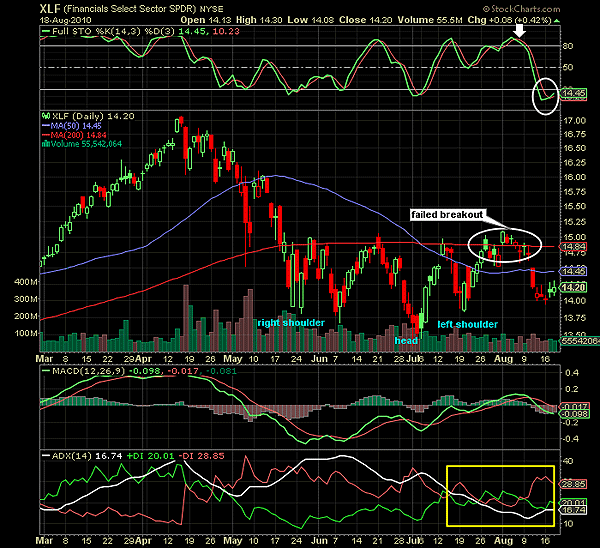
| The Financial Select Sector (XLF) pretended to break out of the 200-day moving average (MA) resistance in June 2010. Considering an overheated downtrend and the climbing full stochastic (14,3,3) in the overbought region, we can visualize the possibility of a bullish breakout. But sometimes, the equities or the index may prove us wrong. Although I had anticipated a sluggish bullish breakout of XLF in June 2010, the sector index plunged from the 200-day MA resistance, forming a lower low below $13.50. XLF tumbled to the new low and immediately sprang toward the resistance line. Due to the second short bullish rally, a blurry picture of an inverted head & shoulder pattern appeared in Figure 1. Later, another bearish rally from the MA resistance confirmed the bullish trend reversal formation. |

|
| FIGURE 1: XLF, DAILY. The sector index failed to breach the 200-day MA resistance. |
| Graphic provided by: StockCharts.com. |
| |
| This time, I decided to observe the price action instead of jumping to conclusions. The technical aspects that helped me in this decision were the weak trend, the highly overbought stochastic oscillator that looked tricky ,and the volatile moving average convergence/divergence (MACD) (12,26,9). The momentum oscillator in Figure 1 frequently changed its direction while ascending from negative to positive territory. As we can see, the MACD was unstable even above the zero line. As a result, the inverted head & shoulders pattern failed to break the 200-day neckline resistance. XLF consolidated in a tight range at the support/resistance of the MA, and ultimately, broke downward. Though the stochastic oscillator at 20 levels signifies a new bullish rally and a fresh buying opportunity, the trade would not succeed due to the 50-day and the 200-day MA resistance. In addition, the trading range is very narrow, which would drag the rally in any direction. |

|
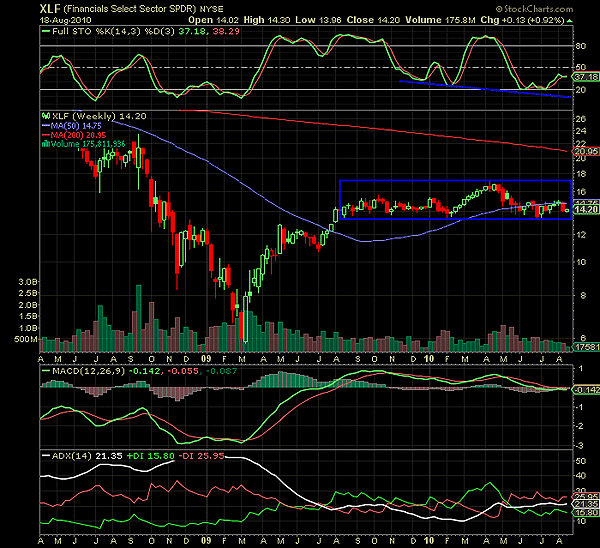
| FIGURE 2: XLF, WEEKLY. The rectangle shows the long-term trading range of XLF. |
| Graphic provided by: StockCharts.com. |
| |
| On the weekly time frame, the narrow trading range is clearly visible. The blue box shows a long-term consolidation range at 18 and 14 levels. We would consider the bullish breakout only above 18 levels, but till then, XLF would continue ranging. The full stochastic (14,3,3) in Figure 2 shows a head & shoulder formation with a descending neckline. Currently, the oscillator has enough room to move toward the neckline support. The ADX (14) is indicating the weak downtrend development, and the gap between the positive directional index (+DI) and the negative directional index (-DI) is very narrow. In addition, the MACD (12,26,9) is riding the zero-line support for almost nine to 10 months. |
| Thus, XLF is likely to move within the range. Breaching the upper range on the weekly time frame or the 200-day MA neckline resistance on the intraday chart would be difficult. |
Active trader in the Indian stock markets since 2003 and a full-time writer. Trading is largely based upon technical analysis.
| Company: | Independent |
| Address: | C1/3 Parth Indraprasth Towers. Vastrapur |
| Ahmedabad, Guj 380015 | |
| E-mail address: | chaitalimohile@yahoo.co.in |
Traders' Resource Links | |
| Independent has not added any product or service information to TRADERS' RESOURCE. | |
Click here for more information about our publications!
Comments

|

Request Information From Our Sponsors
- StockCharts.com, Inc.
- Candle Patterns
- Candlestick Charting Explained
- Intermarket Technical Analysis
- John Murphy on Chart Analysis
- John Murphy's Chart Pattern Recognition
- John Murphy's Market Message
- MurphyExplainsMarketAnalysis-Intermarket Analysis
- MurphyExplainsMarketAnalysis-Visual Analysis
- StockCharts.com
- Technical Analysis of the Financial Markets
- The Visual Investor
- VectorVest, Inc.
- Executive Premier Workshop
- One-Day Options Course
- OptionsPro
- Retirement Income Workshop
- Sure-Fire Trading Systems (VectorVest, Inc.)
- Trading as a Business Workshop
- VectorVest 7 EOD
- VectorVest 7 RealTime/IntraDay
- VectorVest AutoTester
- VectorVest Educational Services
- VectorVest OnLine
- VectorVest Options Analyzer
- VectorVest ProGraphics v6.0
- VectorVest ProTrader 7
- VectorVest RealTime Derby Tool
- VectorVest Simulator
- VectorVest Variator
- VectorVest Watchdog
