HOT TOPICS LIST
- MACD
- Fibonacci
- RSI
- Gann
- ADXR
- Stochastics
- Volume
- Triangles
- Futures
- Cycles
- Volatility
- ZIGZAG
- MESA
- Retracement
- Aroon
INDICATORS LIST
LIST OF TOPICS
PRINT THIS ARTICLE
by Koos van der Merwe
A large number of shares appear to be forming inverted head & shoulder patterns. What is this telling us?
Position: Accumulate
Koos van der Merwe
Has been a technical analyst since 1969, and has worked as a futures and options trader with First Financial Futures in Johannesburg, South Africa.
PRINT THIS ARTICLE
HEAD & SHOULDERS
So Many Inverted Head & Shoulder Patterns
08/19/10 08:21:14 AMby Koos van der Merwe
A large number of shares appear to be forming inverted head & shoulder patterns. What is this telling us?
Position: Accumulate
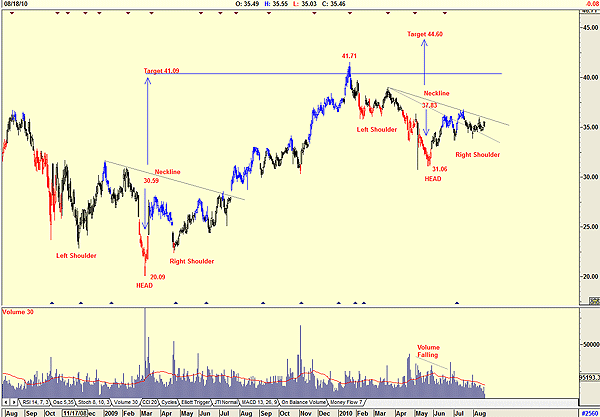
| The inverted head & shoulders pattern is one of the most common and also one of the most reliable of all the major reversal patterns. It consists of a left shoulder, a head, and a right shoulder. The left shoulder is formed usually at the end of an extensive decline, during which volume is not that heavy. At the end of the left shoulder there is usually a small rise, typically on increasing volume. The head then forms with higher volume on the downside and lesser volume accompanying the subsequent reaction. At this point, in order to conform to form, prices must rise to somewhere near the low of the left shoulder -- somewhat higher perhaps or somewhat lower, but in any case, below the bottom of the left shoulder. The right shoulder is then formed by a fall on usually lower volume than any previous falls in this formation. A neckline is now drawn across the tops of the left shoulder, the head, and the right shoulder. Breaking this neckline on a rise in the share price from the right shoulder is the final confirmation and will complete the inverted head & shoulders bottom formation. However, if the breaking of the neckline is done on low volume, we should be suspect of the formation. A high-volume breakout, on the other hand, gives us good reason to believe that the formation is genuine. Do note that very often, after moving higher, prices could pull back to the neckline before continuing the upward rise. We could wait for this pullback to occur before buying. An inverse head & shoulders pattern can also be extremely useful in estimating a possible target as shown on the chart. |

|
| FIGURE 1: MERCK. This chart shows two inverted head & shoulders patterns that have developed. |
| Graphic provided by: AdvancedGET. |
| |
| In Figure 1, Merck Co. rose slightly above the target of $41.09 to $41.71, the target suggested by the first inverse head & shoulders formation (30.59 - 20.09 = 10.50 + 30.59 = 41.09). The second inverse head & shoulders pattern from the upper neckline does suggest a target of $44.50. I have drawn two necklines on the chart, the lower one showing how the price broke above the neckline and then fell back on low volume to test the neckline, suggesting a buy. Inverted head & shoulder patterns are starting to appear on many charts as share prices are starting to recover. Volume is light as many investors are still suspect of a market recovery. Look for them on your charts, and do take advantage of targets offered. |
Has been a technical analyst since 1969, and has worked as a futures and options trader with First Financial Futures in Johannesburg, South Africa.
| Address: | 3256 West 24th Ave |
| Vancouver, BC | |
| Phone # for sales: | 6042634214 |
| E-mail address: | petroosp@gmail.com |
Click here for more information about our publications!
PRINT THIS ARTICLE

|

Request Information From Our Sponsors
- StockCharts.com, Inc.
- Candle Patterns
- Candlestick Charting Explained
- Intermarket Technical Analysis
- John Murphy on Chart Analysis
- John Murphy's Chart Pattern Recognition
- John Murphy's Market Message
- MurphyExplainsMarketAnalysis-Intermarket Analysis
- MurphyExplainsMarketAnalysis-Visual Analysis
- StockCharts.com
- Technical Analysis of the Financial Markets
- The Visual Investor
- VectorVest, Inc.
- Executive Premier Workshop
- One-Day Options Course
- OptionsPro
- Retirement Income Workshop
- Sure-Fire Trading Systems (VectorVest, Inc.)
- Trading as a Business Workshop
- VectorVest 7 EOD
- VectorVest 7 RealTime/IntraDay
- VectorVest AutoTester
- VectorVest Educational Services
- VectorVest OnLine
- VectorVest Options Analyzer
- VectorVest ProGraphics v6.0
- VectorVest ProTrader 7
- VectorVest RealTime Derby Tool
- VectorVest Simulator
- VectorVest Variator
- VectorVest Watchdog
