HOT TOPICS LIST
- MACD
- Fibonacci
- RSI
- Gann
- ADXR
- Stochastics
- Volume
- Triangles
- Futures
- Cycles
- Volatility
- ZIGZAG
- MESA
- Retracement
- Aroon
INDICATORS LIST
LIST OF TOPICS
PRINT THIS ARTICLE
by Alan R. Northam
The Standard & Poor's 500 has now completed an upward correction composed of wave (2) and wave (3) downward under way.
Position: N/A
Alan R. Northam
Alan Northam lives in the Dallas, Texas area and as an electronic engineer gave him an analytical mind from which he has developed a thorough knowledge of stock market technical analysis. His abilities to analyze the future direction of the stock market has allowed him to successfully trade of his own portfolio over the last 30 years. Mr. Northam is now retired and trading the stock market full time. You can reach him at inquiry@tradersclassroom.com or by visiting his website at http://www.tradersclassroom.com. You can also follow him on Twitter @TradersClassrm.
PRINT THIS ARTICLE
ELLIOTT WAVE
Wave (3) Down Under Way
08/13/10 10:39:27 AMby Alan R. Northam
The Standard & Poor's 500 has now completed an upward correction composed of wave (2) and wave (3) downward under way.
Position: N/A
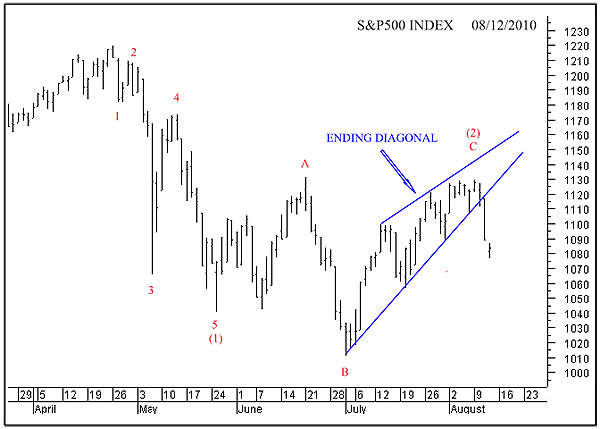
| The Standard & Poor's 500 formed a high pivot point in late April 2010. From that time, the S&P 500 has been headed downward. This downward direction has evolved as five nonoverlapping waves labeled 1, 2, 3, 4, and 5 on the chart. According to Elliott wave theory, five nonoverlapping waves form an impulse wave and impulse waves indicate the direction of the next larger wave. Thus, the next larger wave is made up of waves (1), (2), (3), (4), and (5), of which waves (1) and (2) are now complete. See Figure 1. |

|
| FIGURE 1: S&P 500, DAILY. This chart shows the Elliott wave count and the ending diagonal wave pattern. |
| Graphic provided by: MetaStock. |
| |
| Wave (2) was formed in what the Elliott wave theory calls a "running flat." A running flat is identified such that wave B extends below the end of origin of wave A and wave C ends below the end of wave A. Waves A and B are also made up of smaller ABC zigzags. These are not labeled on the chart. Wave C is then made up of five waves. In our particular case, wave C ended as an ending diagonal. Ending diagonals are made up of five overlapping waves and most often show up in waves 5 or C. |
| With waves (1) and (2) now complete, wave (3) in the downward direction is now under way. Wave (3) will develop as five nonoverlapping waves, which will be labeled waves 1, 2, 3, 4, and 5 just as wave (1) was labeled. The target price for the completion of wave (3) is calculated to be 840 for the S&P 500 or 1.618 times the length of wave (1). |
Alan Northam lives in the Dallas, Texas area and as an electronic engineer gave him an analytical mind from which he has developed a thorough knowledge of stock market technical analysis. His abilities to analyze the future direction of the stock market has allowed him to successfully trade of his own portfolio over the last 30 years. Mr. Northam is now retired and trading the stock market full time. You can reach him at inquiry@tradersclassroom.com or by visiting his website at http://www.tradersclassroom.com. You can also follow him on Twitter @TradersClassrm.
| Garland, Tx | |
| Website: | www.tradersclassroom.com |
| E-mail address: | inquiry@tradersclassroom.com |
Click here for more information about our publications!
PRINT THIS ARTICLE

|

Request Information From Our Sponsors
- StockCharts.com, Inc.
- Candle Patterns
- Candlestick Charting Explained
- Intermarket Technical Analysis
- John Murphy on Chart Analysis
- John Murphy's Chart Pattern Recognition
- John Murphy's Market Message
- MurphyExplainsMarketAnalysis-Intermarket Analysis
- MurphyExplainsMarketAnalysis-Visual Analysis
- StockCharts.com
- Technical Analysis of the Financial Markets
- The Visual Investor
- VectorVest, Inc.
- Executive Premier Workshop
- One-Day Options Course
- OptionsPro
- Retirement Income Workshop
- Sure-Fire Trading Systems (VectorVest, Inc.)
- Trading as a Business Workshop
- VectorVest 7 EOD
- VectorVest 7 RealTime/IntraDay
- VectorVest AutoTester
- VectorVest Educational Services
- VectorVest OnLine
- VectorVest Options Analyzer
- VectorVest ProGraphics v6.0
- VectorVest ProTrader 7
- VectorVest RealTime Derby Tool
- VectorVest Simulator
- VectorVest Variator
- VectorVest Watchdog
