HOT TOPICS LIST
- MACD
- Fibonacci
- RSI
- Gann
- ADXR
- Stochastics
- Volume
- Triangles
- Futures
- Cycles
- Volatility
- ZIGZAG
- MESA
- Retracement
- Aroon
INDICATORS LIST
LIST OF TOPICS
PRINT THIS ARTICLE
by Chaitali Mohile
The US Dollar Index is likely to initiate a bullish reversal rally.
Position: Buy
Chaitali Mohile
Active trader in the Indian stock markets since 2003 and a full-time writer. Trading is largely based upon technical analysis.
PRINT THIS ARTICLE
CHART ANALYSIS
Dollar Index On Reverse Journey
08/13/10 10:26:13 AMby Chaitali Mohile
The US Dollar Index is likely to initiate a bullish reversal rally.
Position: Buy
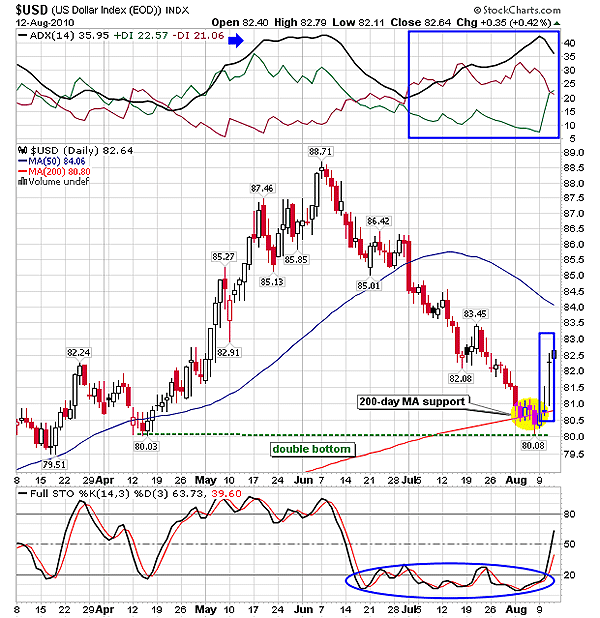
| A descending rally from 88.71 to 80.08 levels of the US Dollar Index ($USD) has dropped the indicators to extreme bearish levels. At 80.08 levels, $USD formed a double bottom--a bullish reversal formation. An overheated uptrend was indicated by the overbought stochastic (14,3,3). As you can see from the chart in Figure 1, the index took a nosedive from the higher levels. Apart from the double-bottom formation at 80.08 levels, $USD has the robust support of 200-day moving average (MA). After the huge correction, the average directional index (ADX) (14) indicated an overheated bearish trend and was tipping down. The stochastic oscillator is highly oversold. We can see the index surged with the support of the 200-day MA (see yellow circle in Figure 1). |

|
| FIGURE 1: USD, DAILY |
| Graphic provided by: StockCharts.com. |
| |
| The two large doji can be seen at what appears to be the start of the rally. The former doji looks like an inverted hammer followed by the long-legged doji. The inverted hammer is a bullish reversal candlestick formation that hammers the existing downtrend and starts a fresh uptrend. The long-legged doji shows high volatility and indecision in trader sentiments. The index moved higher and then sharply dropped to the day's low, finally closing near the intraday high. Here, we can conclude that the fresh rally was initiated on jittery notes. However, the upward-rallying ADX (14) and stochastic oscillators indicate positive momentum in price action. The 50-day MA is the immediate resistance of the rally. |

|
| FIGURE 2: USD, WEEKLY |
| Graphic provided by: StockCharts.com. |
| |
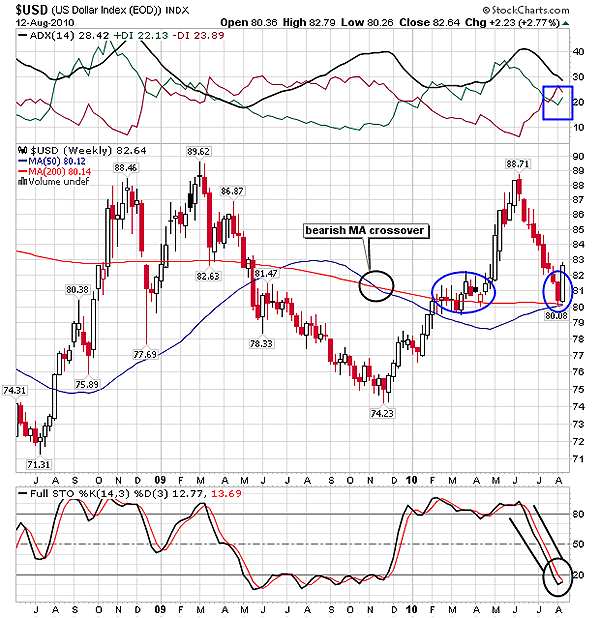
| A bearish moving average crossover in Figure 2 shows marginal weakness in the index. But the short-term MA (50-day) has not plunged deeper; instead, it has again moved closer to the 200-day MA. On the price chart $USD has rested at the support of the two converged MAs, showing significant strength at 80 levels. The ADX (14) has slipped from the overheated uptrend to the developing area at 30 levels. However, the tangled positive and negative directional indexes (+DI)(-DI) suggest equal buying and selling pressures. As a result, the developing uptrend might slow down. The oversold momentum indicator in Figure 2 is indicating that the new bullish rally is under way. Traders can set up fresh long positions at these levels. |
| Thus, $USD may be ready to change its bearish journey to a bullish one for the short-term. Movement in the dollar index is inverse to the movement in equities. So this new upward journey could be giving us a warning of a corrective rally in the financial markets. |
Active trader in the Indian stock markets since 2003 and a full-time writer. Trading is largely based upon technical analysis.
| Company: | Independent |
| Address: | C1/3 Parth Indraprasth Towers. Vastrapur |
| Ahmedabad, Guj 380015 | |
| E-mail address: | chaitalimohile@yahoo.co.in |
Traders' Resource Links | |
| Independent has not added any product or service information to TRADERS' RESOURCE. | |
Click here for more information about our publications!
PRINT THIS ARTICLE

Request Information From Our Sponsors
- StockCharts.com, Inc.
- Candle Patterns
- Candlestick Charting Explained
- Intermarket Technical Analysis
- John Murphy on Chart Analysis
- John Murphy's Chart Pattern Recognition
- John Murphy's Market Message
- MurphyExplainsMarketAnalysis-Intermarket Analysis
- MurphyExplainsMarketAnalysis-Visual Analysis
- StockCharts.com
- Technical Analysis of the Financial Markets
- The Visual Investor
- VectorVest, Inc.
- Executive Premier Workshop
- One-Day Options Course
- OptionsPro
- Retirement Income Workshop
- Sure-Fire Trading Systems (VectorVest, Inc.)
- Trading as a Business Workshop
- VectorVest 7 EOD
- VectorVest 7 RealTime/IntraDay
- VectorVest AutoTester
- VectorVest Educational Services
- VectorVest OnLine
- VectorVest Options Analyzer
- VectorVest ProGraphics v6.0
- VectorVest ProTrader 7
- VectorVest RealTime Derby Tool
- VectorVest Simulator
- VectorVest Variator
- VectorVest Watchdog
