HOT TOPICS LIST
- MACD
- Fibonacci
- RSI
- Gann
- ADXR
- Stochastics
- Volume
- Triangles
- Futures
- Cycles
- Volatility
- ZIGZAG
- MESA
- Retracement
- Aroon
INDICATORS LIST
LIST OF TOPICS
PRINT THIS ARTICLE
by Donald W. Pendergast, Jr.
It can be intimidating to buy a stock that's already made a major run higher, but sometimes it's worth the discomfort.
Position: N/A
Donald W. Pendergast, Jr.
Donald W. Pendergast is a financial markets consultant who offers specialized services to stock brokers and high net worth individuals who seek a better bottom line for their portfolios.
PRINT THIS ARTICLE
AROON
With Rubicon Minerals, More Gains Possible
08/13/10 09:04:59 AMby Donald W. Pendergast, Jr.
It can be intimidating to buy a stock that's already made a major run higher, but sometimes it's worth the discomfort.
Position: N/A
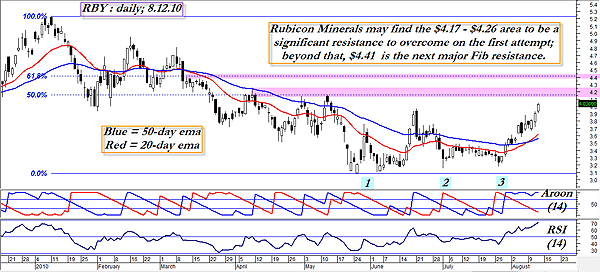
| Shares of Vancouver BC-based Rubicon Mining are up by more than 30% since the stock hammered out a small but well-defined double-bottom pattern from late May to early June 2010 before going on to print a slightly sloppy but very visible triple-bottom pattern. Right now, the stock is at an eight-week high and is still rising. How much further can Rubicon rise before the profit-takers start calling the shots in this fast-moving miner? Let's take a look at the daily chart for RBY and see what's going on (Figure 1). |

|
| FIGURE 1: RBY, DAILY. Strongly trending stocks can keep on moving for far longer than we might otherwise assume, but it still pays to know where the most likely area of support and resistance are, especially if you're already long or short a particular stock. |
| Graphic provided by: MetaStock. |
| |
| By all accounts, the current trend configuration would seem to favor higher prices in RBY. The Aroon 14-period trend intensity indicator is full-tilt bullish, with a reading of "Aroon Up 100," and the relative strength index (RSI) (14) is also confirming exceptional trend strength with a reading of 71.51. In addition, the 20-period exponential moving average (EMA) is above the 50-period EMA, with the spread between the two EMAs increasing. Finally, RBY took out the June high of $3.97, closing at $4.03. All in all, RBY still looks to be in fine shape -- from a mining bull's viewpoint, of course. See Figure 2. |

|
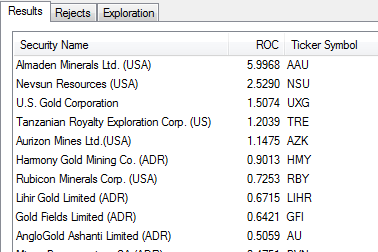
| FIGURE 2: MINING GROUP. As strong as Rubicon Minerals is currently, there are at least a half-dozen more stocks from the precious metals (PM) mining group that are also in rocket mode right now, compared to GDX, the major PM mining stock ETF. |
| Graphic provided by: MetaStock. |
| Graphic provided by: MetaStock Explorer. |
| |
| Major Fibonacci resistance resides at $4.17 (the 50% retracement of the substantial January-May downtrend) and then again at a minor swing high coming in at $4.26. Beyond these, the major Fibonacci 61.8% retracement lives at $4.41 and should also offer some sort of resistance or pullback action in this highly volatile issue. Looking at the MetaStock Explorer output, you can see that RBY has exceptionally good relative strength (RS) versus GDX, the large exchange traded fund (ETF) that tracks the price of major precious metals stocks. Incredibly, there are seven other stocks from the same industry group with even better RS readings compared to GDX. There should be no trouble locating suitable intraday setups in any of these volatile stocks, especially if you already use a proven system to time entries and exits. |
| Playing Rubicon might involve something as simple as waiting for an intraday pullback from a possible move into resistance at $4.17, using a 15- to 30-minute chart to help time a long entry from a pullback support level. Intraday traders could also place buy-stops a tick above the resistance ($4.18 might be the best place), hoping to capitalize on an intraday surge higher above this key price level. I've made intraday trades using similar setups with floor trader pivots on various emini stock index futures contracts and have been frequently (but not always) rewarded with relatively fast profits with low risk. The price dynamics surrounding most kinds of horizontal support/resistance levels appears to be very similar across time frames and trading instruments, so you may also want to investigate the use of this trading technique on your own. |
Donald W. Pendergast is a financial markets consultant who offers specialized services to stock brokers and high net worth individuals who seek a better bottom line for their portfolios.
| Title: | Writer, market consultant |
| Company: | Linear Trading Systems LLC |
| Jacksonville, FL 32217 | |
| Phone # for sales: | 904-239-9564 |
| E-mail address: | lineartradingsys@gmail.com |
Traders' Resource Links | |
| Linear Trading Systems LLC has not added any product or service information to TRADERS' RESOURCE. | |
Click here for more information about our publications!
PRINT THIS ARTICLE

Request Information From Our Sponsors
- StockCharts.com, Inc.
- Candle Patterns
- Candlestick Charting Explained
- Intermarket Technical Analysis
- John Murphy on Chart Analysis
- John Murphy's Chart Pattern Recognition
- John Murphy's Market Message
- MurphyExplainsMarketAnalysis-Intermarket Analysis
- MurphyExplainsMarketAnalysis-Visual Analysis
- StockCharts.com
- Technical Analysis of the Financial Markets
- The Visual Investor
- VectorVest, Inc.
- Executive Premier Workshop
- One-Day Options Course
- OptionsPro
- Retirement Income Workshop
- Sure-Fire Trading Systems (VectorVest, Inc.)
- Trading as a Business Workshop
- VectorVest 7 EOD
- VectorVest 7 RealTime/IntraDay
- VectorVest AutoTester
- VectorVest Educational Services
- VectorVest OnLine
- VectorVest Options Analyzer
- VectorVest ProGraphics v6.0
- VectorVest ProTrader 7
- VectorVest RealTime Derby Tool
- VectorVest Simulator
- VectorVest Variator
- VectorVest Watchdog
