HOT TOPICS LIST
- MACD
- Fibonacci
- RSI
- Gann
- ADXR
- Stochastics
- Volume
- Triangles
- Futures
- Cycles
- Volatility
- ZIGZAG
- MESA
- Retracement
- Aroon
INDICATORS LIST
LIST OF TOPICS
PRINT THIS ARTICLE
by Chaitali Mohile
The upward rally of Dollar Tree is almost exhausted. Will the ascending channel break downward?
Position: Hold
Chaitali Mohile
Active trader in the Indian stock markets since 2003 and a full-time writer. Trading is largely based upon technical analysis.
PRINT THIS ARTICLE
CHART ANALYSIS
DLTR Rally Under Threat?
08/11/10 11:38:14 AMby Chaitali Mohile
The upward rally of Dollar Tree is almost exhausted. Will the ascending channel break downward?
Position: Hold
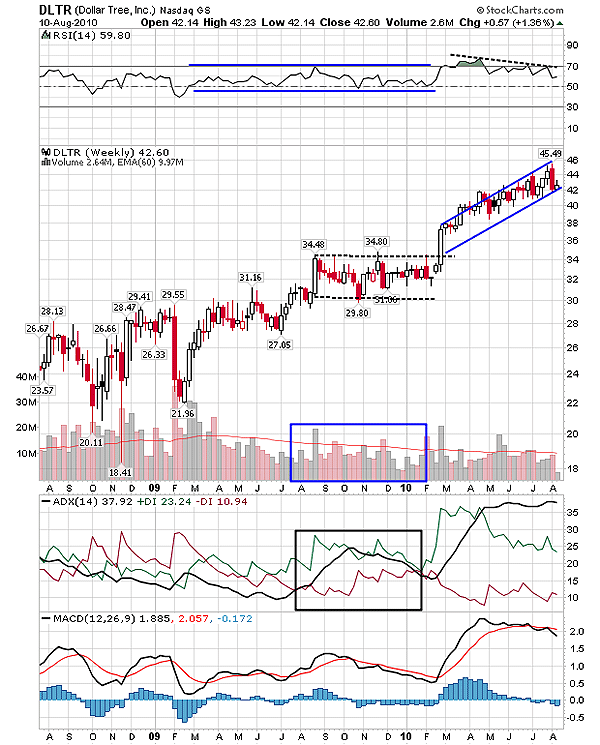
| In 2009, Dollar Tree (DLTR) consolidated in a range of $34 to $29 for about six months. The black dotted lines in Figure 1 show the perfect horizontal consolidation of the stock. Similarly, the relative strength index (RSI) (14) was trapped in healthy bullish levels of 50 and 70. The average directional index (ADX) (14) indicated a developing uptrend by moving between 20/25 levels. The indicators suggested a bullish breakout of the consolidation range. During consolidation, the price movement is highly uncertain, and as a result, the volume in Figure 1 is shaky. The earlier advance rally of DLTR from $21.96 to $34.48 added the bullish sentiment to the consolidation, highlighting the possibility of the bullish breakout. |
| Accordingly, DLTR broke upward in March 2010. We can see in Figure 1 that the stock breached the upper range on stronger volume and moved up. Gradually, the fresh rally formed an ascending channel. The moving average convergence/divergence (MACD) (12,26,9) underwent a bullish crossover in positive territory itself, and the ADX(14) once again indicated the developing uptrend. The ascending channel pulled the ADX (14) above 30 levels with huge buying pressure. The RSI (14) turned overbought by moving above 70 levels. The channel moved higher and hit new highs at 45 levels. However, we can see that the lower trendline is now challenged. The two long bearish candles of June and July showed significant bearish strength that diluted the gains of past weeks. In July, the red candle covered the previous three bullish candles. |

|
| FIGURE 1: DLTR, WEEKLY. The lower trendline of the ascending channel is retested. The well-developed uptrend would protect DLTR by undergoing the bearish breakout |
| Graphic provided by: StockCharts.com. |
| |
| The RSI (14) and the MACD (12,26,9) formed a lower high, developing a negative divergence for the bullish rally. This would have increased the bearish force on the rally. The bearish breakout would result in a huge trend reversal rally, which is currently not indicated on the charts. Since the uptrend is well developed, the ascending channel will probably not be breached downward. The negative divergence may generate volatility in the current rally. Traders can hold their long position till DLTR sustains the lower trendline support and keep a stop-loss at $38 to protect their trade. Thus, the chart suggests slow price movement for DLTR. |
Active trader in the Indian stock markets since 2003 and a full-time writer. Trading is largely based upon technical analysis.
| Company: | Independent |
| Address: | C1/3 Parth Indraprasth Towers. Vastrapur |
| Ahmedabad, Guj 380015 | |
| E-mail address: | chaitalimohile@yahoo.co.in |
Traders' Resource Links | |
| Independent has not added any product or service information to TRADERS' RESOURCE. | |
Click here for more information about our publications!
PRINT THIS ARTICLE

Request Information From Our Sponsors
- VectorVest, Inc.
- Executive Premier Workshop
- One-Day Options Course
- OptionsPro
- Retirement Income Workshop
- Sure-Fire Trading Systems (VectorVest, Inc.)
- Trading as a Business Workshop
- VectorVest 7 EOD
- VectorVest 7 RealTime/IntraDay
- VectorVest AutoTester
- VectorVest Educational Services
- VectorVest OnLine
- VectorVest Options Analyzer
- VectorVest ProGraphics v6.0
- VectorVest ProTrader 7
- VectorVest RealTime Derby Tool
- VectorVest Simulator
- VectorVest Variator
- VectorVest Watchdog
- StockCharts.com, Inc.
- Candle Patterns
- Candlestick Charting Explained
- Intermarket Technical Analysis
- John Murphy on Chart Analysis
- John Murphy's Chart Pattern Recognition
- John Murphy's Market Message
- MurphyExplainsMarketAnalysis-Intermarket Analysis
- MurphyExplainsMarketAnalysis-Visual Analysis
- StockCharts.com
- Technical Analysis of the Financial Markets
- The Visual Investor
