

HOT TOPICS LIST
- MACD
- Fibonacci
- RSI
- Gann
- ADXR
- Stochastics
- Volume
- Triangles
- Futures
- Cycles
- Volatility
- ZIGZAG
- MESA
- Retracement
- Aroon
INDICATORS LIST
LIST OF TOPICS
PRINT THIS ARTICLE
by Donald W. Pendergast, Jr.
When a strong relative strength stock makes a new high after a break in major resistance, savvy traders plan ahead for a possible long reentry point.
Position: N/A
Donald W. Pendergast, Jr.
Donald W. Pendergast is a financial markets consultant who offers specialized services to stock brokers and high net worth individuals who seek a better bottom line for their portfolios.
PRINT THIS ARTICLE
SUPPORT & RESISTANCE
ENDP Prior Resistance May Become Support Area
08/11/10 09:03:12 AMby Donald W. Pendergast, Jr.
When a strong relative strength stock makes a new high after a break in major resistance, savvy traders plan ahead for a possible long reentry point.
Position: N/A
| With the broad market pausing, moving without conviction in either direction, scanning for stocks making new 52-week highs can be one way to zero in on long stock setups with a higher probability of profit. Here's a look at one such stock in the pharmaceutical industry group, one located by the Deel New Highs exploration in MetaStock. |
|
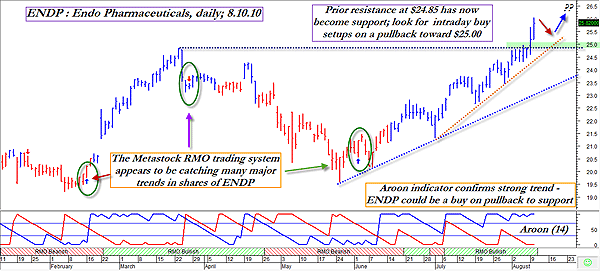
| FIGURE 1: ENDP, DAILY. Maybe it will and maybe it won't, but if ENDP does pull back toward $25, plenty of intraday traders will be armed and ready to deploy fresh trading capital for another crack at another run to a new high. |
| Graphic provided by: MetaStock. |
| Graphic provided by: Rahul Mohindar (RMO) tools from MetaStock v.11. |
| |
| In the stock market, you really have two kinds of technical traders: In the first group are those who look to buy pullbacks to support (or sell short at resistance) in a strong up (down) trend, and in the second group you have those who subscribe to the theory of "buy high and sell higher." In Figure 1, a chart for Endo Pharmaceuticals (ENDP), we see a stock that has already been moved dramatically higher by the second group (buy high, sell higher) over the past two months, so much so that the stock is now sitting at a new yearly high. At some point, ENDP needs to correct, digest some of the recent gains, and then perhaps even move higher, and that's where the traders from group 1 can go to the rescue of group 2. And it's easy to see where the most opportune price area for them to buy on a pullback actually is -- right at or just above the prior resistance line at $24.85, a line that may very well act as a strong support level. Traders using 15- to 60-minute intraday charts may find any number of long reentry setup off of support, should ENDP decide to do a daily pullback sooner rather than later. ENDP has exceptionally strong 13-week relative strength versus the Standard & Poor's 500, and the accelerating trendlines and slightly parabolic price action certainly confirm that fact. In addition, the Aroon 14-period trend intensity indicator is also near the upper end of its range, pegged at its maximum reading of 100. Of course, any stock can reverse trajectory without prior warning, but all in all, this is one trend that should be given every benefit of the doubt. Here's another interesting item for systems-type traders -- the MetaStock RMO trading system (blue and red arrows in the ovals) has caught eight substantial daily trend moves in the aftermath of the most recent 14 buy/sell arrows. Of the six signals that weren't profitable, all were reversed with only modest losses. Apparently, the RMO swing buy signals are in tune with the last 14 months' worth of price action in ENDP. It's definitely a trading system worth looking into, especially if you already own or plan to acquire MetaStock at some point. |
|
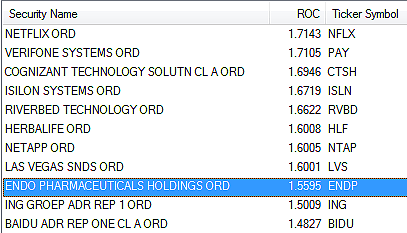
| FIGURE 2: RELATIVE STRENGTH RANKING. ENDP has a very strong relative strength ranking versus the S&P 500, yet another plus for those looking for another chance to go long this stock again. |
| Graphic provided by: MetaStock. |
| Graphic provided by: MetaStock Explorer. |
| |
| Above you can see the relative strength ranking of ENDP versus the S&P 500; any reading above zero means that the stock is outperforming the index (or any other stock, ETF, or futures contract you desire to compare it to) for the time frame specified. In this case, we're using a 13-week rate of change (ROC) calculation, and the output tells us that ENDP is doing much better than the .SPX. When buying stocks, always try to focus on those with the strongest ROC rankings versus the broad market indexes. You could also compare ENDP's ROC against the NASDAQ Composite Index, Russell 2000, or even against PPH, the Pharmaceutical HOLDR exchange traded fund, the stock's primary industry group. The possibilities are limitless, allowing you to discover plenty of useful and profitable ways to use this valuable stock ranking tool. |
Donald W. Pendergast is a financial markets consultant who offers specialized services to stock brokers and high net worth individuals who seek a better bottom line for their portfolios.
| Title: | Writer, market consultant |
| Company: | Linear Trading Systems LLC |
| Jacksonville, FL 32217 | |
| Phone # for sales: | 904-239-9564 |
| E-mail address: | lineartradingsys@gmail.com |
Traders' Resource Links | |
| Linear Trading Systems LLC has not added any product or service information to TRADERS' RESOURCE. | |
Click here for more information about our publications!
PRINT THIS ARTICLE

Request Information From Our Sponsors
- StockCharts.com, Inc.
- Candle Patterns
- Candlestick Charting Explained
- Intermarket Technical Analysis
- John Murphy on Chart Analysis
- John Murphy's Chart Pattern Recognition
- John Murphy's Market Message
- MurphyExplainsMarketAnalysis-Intermarket Analysis
- MurphyExplainsMarketAnalysis-Visual Analysis
- StockCharts.com
- Technical Analysis of the Financial Markets
- The Visual Investor
- VectorVest, Inc.
- Executive Premier Workshop
- One-Day Options Course
- OptionsPro
- Retirement Income Workshop
- Sure-Fire Trading Systems (VectorVest, Inc.)
- Trading as a Business Workshop
- VectorVest 7 EOD
- VectorVest 7 RealTime/IntraDay
- VectorVest AutoTester
- VectorVest Educational Services
- VectorVest OnLine
- VectorVest Options Analyzer
- VectorVest ProGraphics v6.0
- VectorVest ProTrader 7
- VectorVest RealTime Derby Tool
- VectorVest Simulator
- VectorVest Variator
- VectorVest Watchdog