HOT TOPICS LIST
- MACD
- Fibonacci
- RSI
- Gann
- ADXR
- Stochastics
- Volume
- Triangles
- Futures
- Cycles
- Volatility
- ZIGZAG
- MESA
- Retracement
- Aroon
INDICATORS LIST
LIST OF TOPICS
PRINT THIS ARTICLE
by Koos van der Merwe
The basic rule is to buy at double or triple bottoms, but what happens at a quadruple bottom?
Position: Sell
Koos van der Merwe
Has been a technical analyst since 1969, and has worked as a futures and options trader with First Financial Futures in Johannesburg, South Africa.
PRINT THIS ARTICLE
TRIANGLES
Is Visa Following The Basic Rule?
08/10/10 08:04:51 AMby Koos van der Merwe
The basic rule is to buy at double or triple bottoms, but what happens at a quadruple bottom?
Position: Sell
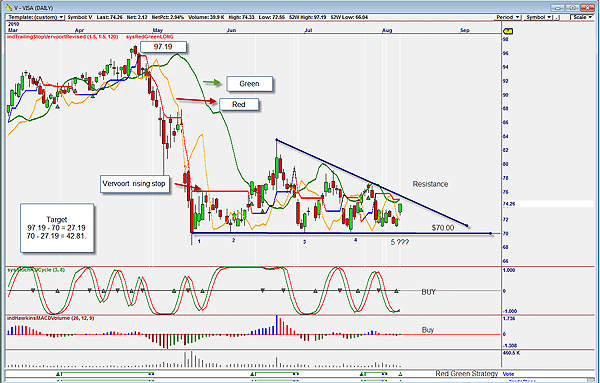
| We should never forget that the third time a stock tests a bottom, it is not safe to buy because in most cases it breaks the bottom and continues down. The chart of Visa suggests that this could be happening. |

|
| FIGURE 1: VISA, DAILY |
| Graphic provided by: OmniTrader. |
| |
| Figure 1 shows how the stock price of Visa has tested the $70 support line four times and is currently rising to test the resistance line of the descending triangle pattern that has developed. This suggests that should the share price of Visa fall, it could test and break through the $70 support line and fall dramatically. This is a pure technical analysis rule -- that is, when a share price tests a base for the third time, it usually breaks through the fourth time. The descending triangle that has formed is suggesting a target of $42.81. The strong base that has developed has led many to believe that Visa has found strong support at the $70 level and is giving a buy signal. This is confirmed by the two indicators on the chart, a stochastic RSI cycle and a Hawkins MACD volume indicator. Whether this buy signal will be a short-term buy or the price will soon fall to test and break below the $70 level with a $42.81 target is a matter of putting our trust in the charts. I would not be a buyer of Visa because of the charts. However, I shall watch the movement of the stock price with interest to see if it will follow the basic rule. |
Has been a technical analyst since 1969, and has worked as a futures and options trader with First Financial Futures in Johannesburg, South Africa.
| Address: | 3256 West 24th Ave |
| Vancouver, BC | |
| Phone # for sales: | 6042634214 |
| E-mail address: | petroosp@gmail.com |
Click here for more information about our publications!
PRINT THIS ARTICLE

Request Information From Our Sponsors
- StockCharts.com, Inc.
- Candle Patterns
- Candlestick Charting Explained
- Intermarket Technical Analysis
- John Murphy on Chart Analysis
- John Murphy's Chart Pattern Recognition
- John Murphy's Market Message
- MurphyExplainsMarketAnalysis-Intermarket Analysis
- MurphyExplainsMarketAnalysis-Visual Analysis
- StockCharts.com
- Technical Analysis of the Financial Markets
- The Visual Investor
- VectorVest, Inc.
- Executive Premier Workshop
- One-Day Options Course
- OptionsPro
- Retirement Income Workshop
- Sure-Fire Trading Systems (VectorVest, Inc.)
- Trading as a Business Workshop
- VectorVest 7 EOD
- VectorVest 7 RealTime/IntraDay
- VectorVest AutoTester
- VectorVest Educational Services
- VectorVest OnLine
- VectorVest Options Analyzer
- VectorVest ProGraphics v6.0
- VectorVest ProTrader 7
- VectorVest RealTime Derby Tool
- VectorVest Simulator
- VectorVest Variator
- VectorVest Watchdog
