HOT TOPICS LIST
- MACD
- Fibonacci
- RSI
- Gann
- ADXR
- Stochastics
- Volume
- Triangles
- Futures
- Cycles
- Volatility
- ZIGZAG
- MESA
- Retracement
- Aroon
INDICATORS LIST
LIST OF TOPICS
PRINT THIS ARTICLE
by Donald W. Pendergast, Jr.
TAO, the exchange traded fund that tracks the performance of real-estate sector equities in China, continues to perform well.
Position: N/A
Donald W. Pendergast, Jr.
Donald W. Pendergast is a financial markets consultant who offers specialized services to stock brokers and high net worth individuals who seek a better bottom line for their portfolios.
PRINT THIS ARTICLE
MOVING AVERAGES
TAO, China Real Estate ETF, Powers Higher
08/09/10 09:54:30 AMby Donald W. Pendergast, Jr.
TAO, the exchange traded fund that tracks the performance of real-estate sector equities in China, continues to perform well.
Position: N/A
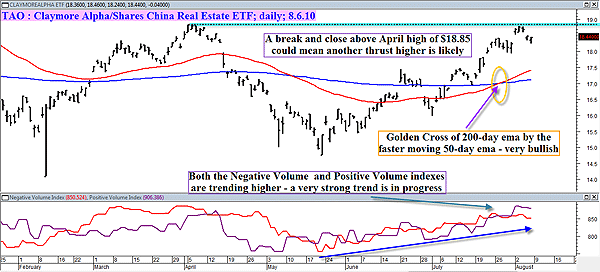
| When a major index or industry group/sector makes a golden cross, sentiment begins to shift toward the bullish side of the ledger, all else being equal. That's certainly the case with TAO, a key exchange traded fund (ETF) that tracks one of the true bellwether industry groups of our time -- the stocks of the burgeoning, volatile, and increasingly important Chinese real estate market. Figure 1 is a closer look at a few of the technical dynamics on TAO's daily chart. |

|
| FIGURE 1: TAO, DAILY. A minor pullback just shy of a major swing high, one occurring in the wake of a golden cross -- with both key volume indexes in bullish agreement -- could be a prime, low-risk buying opportunity. |
| Graphic provided by: MetaStock. |
| |
| In no particular order of importance, here are the main technical factors that may imply that shares of TAO are destined to rise further before a meaningful correction sets in: 1. The recent golden cross of the 200-day exponential moving average (EMA) (blue line) by the faster 50-day EMA (red line) is normally viewed as an especially bullish event, especially since such crosses don't happen every other day. 2. At the lower portion of the chart, we see that both the negative volume (NVI) and positive volume (PVI) indexes are rising in tandem, another confirmation of a very powerful bull market in motion. By the way, the same dynamic works in bear markets, only in reverse; when both the PVI and NVI are falling together, it makes for an extremely accurate way to confirm the strength of a falling market. 3. The 13-week (one calendar quarter) rate of change for TAO versus the Standard & Poor's 500 and Russell 2000 indexes also confirms just how strong this Asian real estate ETF truly is; it's outperforming both of those key US indexes by a factor of better than 2 to 1, clearly showing the preference of major institutions for emerging market equities right now. It's hard to argue with a strong trend, and attempting to call a top in such a strong market is probably an exercise in futility. The best way to play TAO is to buy proper pullbacks to (trader-defined) support, and that might be one such opportunity right before you on the chart. In fact, all of the three major US stock indexes printed very bullish daily reversal bars this past Friday, so we may be getting ready for a nice little pop in many of the global indexes this week. With TAO now within $0.41 of its recent high ($18.85 on April 6, 2010), this could be a nice and easy long entry point, one offering an attractive risk to reward ratio. See Figure 2. |

|
| FIGURE 2: GLOBAL ETFS. Of the 55 global ETFs that Pendergast tracks, four of the top five hail from emerging markets territory, and three of those hold only Chinese market equities. Here we see the 13-week rate of change of these major ETFs versus the Russell 2000 (.RUT, IWM). Emerging markets are truly hot right now. |
| Graphic provided by: MetaStock. |
| Graphic provided by: MetaStock Explorer. |
| |
| Relative strength comparisons between indexes, ETFs, and stocks are still one of the most effective tools available for equity traders of every persuasion. The big boys in the market make use of this valuable technical tool every day, and you need to do the same thing if you hope to win consistently in the markets. Give it a try and watch how it improves your stock trading performance. |
Donald W. Pendergast is a financial markets consultant who offers specialized services to stock brokers and high net worth individuals who seek a better bottom line for their portfolios.
| Title: | Writer, market consultant |
| Company: | Linear Trading Systems LLC |
| Jacksonville, FL 32217 | |
| Phone # for sales: | 904-239-9564 |
| E-mail address: | lineartradingsys@gmail.com |
Traders' Resource Links | |
| Linear Trading Systems LLC has not added any product or service information to TRADERS' RESOURCE. | |
Click here for more information about our publications!
PRINT THIS ARTICLE

Request Information From Our Sponsors
- StockCharts.com, Inc.
- Candle Patterns
- Candlestick Charting Explained
- Intermarket Technical Analysis
- John Murphy on Chart Analysis
- John Murphy's Chart Pattern Recognition
- John Murphy's Market Message
- MurphyExplainsMarketAnalysis-Intermarket Analysis
- MurphyExplainsMarketAnalysis-Visual Analysis
- StockCharts.com
- Technical Analysis of the Financial Markets
- The Visual Investor
- VectorVest, Inc.
- Executive Premier Workshop
- One-Day Options Course
- OptionsPro
- Retirement Income Workshop
- Sure-Fire Trading Systems (VectorVest, Inc.)
- Trading as a Business Workshop
- VectorVest 7 EOD
- VectorVest 7 RealTime/IntraDay
- VectorVest AutoTester
- VectorVest Educational Services
- VectorVest OnLine
- VectorVest Options Analyzer
- VectorVest ProGraphics v6.0
- VectorVest ProTrader 7
- VectorVest RealTime Derby Tool
- VectorVest Simulator
- VectorVest Variator
- VectorVest Watchdog
