HOT TOPICS LIST
- MACD
- Fibonacci
- RSI
- Gann
- ADXR
- Stochastics
- Volume
- Triangles
- Futures
- Cycles
- Volatility
- ZIGZAG
- MESA
- Retracement
- Aroon
INDICATORS LIST
LIST OF TOPICS
PRINT THIS ARTICLE
by Austin Passamonte
Here's the mid-term outlook for soybean futures pricing.
Position: N/A
Austin Passamonte
Austin is a private trader who trades emini stock index futures intraday. He currently trades various futures markets from home in addition to managing a trader's educational forum
PRINT THIS ARTICLE
TECHNICAL ANALYSIS
Grain Elevator
08/06/10 09:06:41 AMby Austin Passamonte
Here's the mid-term outlook for soybean futures pricing.
Position: N/A
| Grain commodity markets action usually heats up in the summer sun. Mix in a little (or a lot) of rain, hail, drought, or various forms of crop pestilence, and you never know what to expect. "Beans in the teens" is a common catch phrase this time of year. How probable is that for 2010? |

|
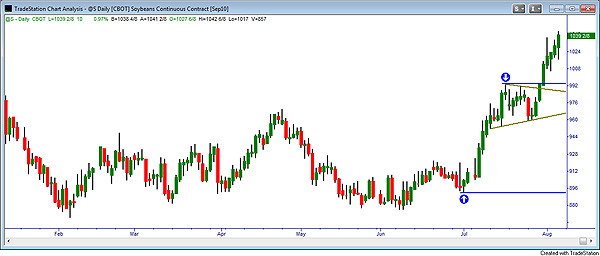
| FIGURE 1: SOYBEAN FUTURES, DAILY |
| Graphic provided by: TradeStation. |
| |
| Figure 1, a daily chart view, shows where soybean futures lifted from lows near 880 and coiled in wedge fashion before continuing on upward since. That pause in the ascent usually marks roughly 50% of the eventual range from relative low to high. Measuring 890 to 990 as the first leg projects 990 to 1090 in the second leg before a probable pause occurs. |

|
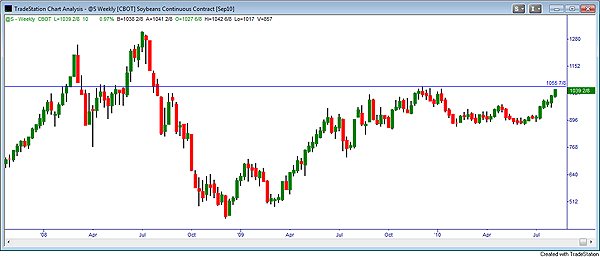
| FIGURE 2: SOYBEAN FUTURES, WEEKLY |
| Graphic provided by: TradeStation. |
| |
| The weekly chart (Figure 2) shows 1056 to be a historical congestion level dating back to the wild times of late 2008 to early 2009. It held the prior test of resistance in late 2009 and awaits a push upward for resolution. |

|
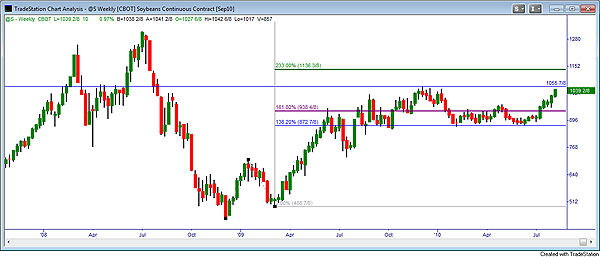
| FIGURE 3: SOYBEAN FUTURES, WEEKLY |
| Graphic provided by: TradeStation. |
| |
| Adding a Fibonacci projection off 1-2-3 low swing shows where 138 and 162 marks attracted price action. The next level above at 233% is within ready reach and bisects weekly open-close levels from high peak bars in 2008. See Figure 3. |
| "Teens" pricing may be a little ambitious to plan for. But 11- to 12-cent ranges appear more probable than not, judging from price measured across several different angles and views. Thus, higher grain prices have the current nod until proven otherwise. |
Austin is a private trader who trades emini stock index futures intraday. He currently trades various futures markets from home in addition to managing a trader's educational forum
| Title: | Individual Trader |
| Company: | CoiledMarkets.com |
| Address: | PO Box 633 |
| Naples, NY 14512 | |
| Website: | coiledmarkets.com/blog |
| E-mail address: | austinp44@yahoo.com |
Traders' Resource Links | |
| CoiledMarkets.com has not added any product or service information to TRADERS' RESOURCE. | |
Click here for more information about our publications!
Comments
Date: 08/10/10Rank: 5Comment:

|

Request Information From Our Sponsors
- StockCharts.com, Inc.
- Candle Patterns
- Candlestick Charting Explained
- Intermarket Technical Analysis
- John Murphy on Chart Analysis
- John Murphy's Chart Pattern Recognition
- John Murphy's Market Message
- MurphyExplainsMarketAnalysis-Intermarket Analysis
- MurphyExplainsMarketAnalysis-Visual Analysis
- StockCharts.com
- Technical Analysis of the Financial Markets
- The Visual Investor
- VectorVest, Inc.
- Executive Premier Workshop
- One-Day Options Course
- OptionsPro
- Retirement Income Workshop
- Sure-Fire Trading Systems (VectorVest, Inc.)
- Trading as a Business Workshop
- VectorVest 7 EOD
- VectorVest 7 RealTime/IntraDay
- VectorVest AutoTester
- VectorVest Educational Services
- VectorVest OnLine
- VectorVest Options Analyzer
- VectorVest ProGraphics v6.0
- VectorVest ProTrader 7
- VectorVest RealTime Derby Tool
- VectorVest Simulator
- VectorVest Variator
- VectorVest Watchdog
