

HOT TOPICS LIST
- MACD
- Fibonacci
- RSI
- Gann
- ADXR
- Stochastics
- Volume
- Triangles
- Futures
- Cycles
- Volatility
- ZIGZAG
- MESA
- Retracement
- Aroon
INDICATORS LIST
LIST OF TOPICS
PRINT THIS ARTICLE
by Alan R. Northam
The long-term and intermediate-term trends are critical to the health of a bull or bear market. Currently, IWM remains in a bull market, but its health is critical. These two lifelines need to stay healthy to keep the bull market alive for IWM.
Position: N/A
Alan R. Northam
Alan Northam lives in the Dallas, Texas area and as an electronic engineer gave him an analytical mind from which he has developed a thorough knowledge of stock market technical analysis. His abilities to analyze the future direction of the stock market has allowed him to successfully trade of his own portfolio over the last 30 years. Mr. Northam is now retired and trading the stock market full time. You can reach him at inquiry@tradersclassroom.com or by visiting his website at http://www.tradersclassroom.com. You can also follow him on Twitter @TradersClassrm.
PRINT THIS ARTICLE
MOMENTUM
IWM In Uptrend But Critical
08/05/10 09:06:03 AMby Alan R. Northam
The long-term and intermediate-term trends are critical to the health of a bull or bear market. Currently, IWM remains in a bull market, but its health is critical. These two lifelines need to stay healthy to keep the bull market alive for IWM.
Position: N/A
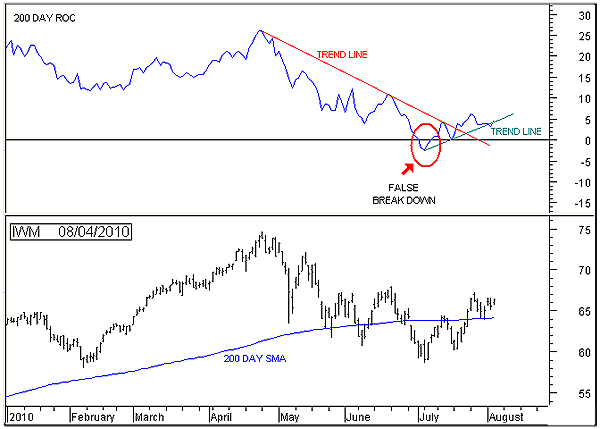
| The iShares Russell 2000 Index (IWM) ETF represents the small-cap sector of the broader US equity market. By using the rate of change (ROC) indicator in three different time frames, it is possible to determine the long-term, intermediate-term, and short-term trends of this market. Figure 1 shows the long-term trend. The top pane shows the 200-day ROC, which is used to determine the long-term trend of this market. The bottom pane shows the price chart of IWM and its 200-day simple moving average (SMA). Note in Figure 1 that the 200-day ROC peaked in mid-April along with price and then started moving down. In addition, note that ROC peaked at 26. This means that at its peak, IWM was $26 higher than it was 200 days ago. In early July, ROC crossed below its zero line. This crossing indicates that IWM was at the same price it was 200 days ago. So between April and July, the difference between price and the price 200 days ago continued to shrink; this is referred to as price deceleration. During early July, ROC was negative by as much as 2.6. This meant that IWM was $2.60 lower than it was 200 days ago. However, since then ROC has turned back positive. When ROC is above its zero line, it means that price is higher than it was 200 days ago, indicating a long-term uptrend in progress. And when ROC is below its zero line, it indicates that price is lower than it was 200 days ago, signaling that price is in a long-term downtrend. Price did not remain below its zero line, but the few days before it moved back above it is known as a false breakdown. ROC continues to trend up, signaling that price is once again starting to accelerate, keeping the long-term trend intact. For more on how to measure trend with a momentum indicator, refer to the Traders.com Advantage article "Momentum Indicator Measures Trend" (June 29). |
|
| FIGURE 1: IWM, DAILY. The chart shows price chart and a 200-day simple moving average in the bottom pane and the 200-day ROC in the top pane. |
| Graphic provided by: MetaStock. |
| |
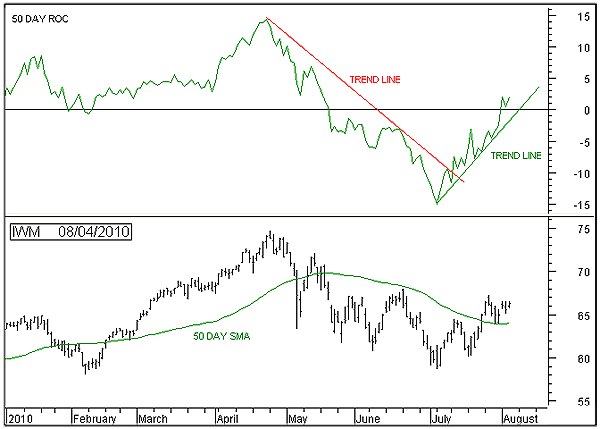
| Figure 2 shows the 50-day ROC above the price charts. The 50-day ROC is used to measure the intermediate-term trend of IWM. Note that in early July, ROC bottomed at -15. This meant that IWM was $15 lower than it was 50 days ago, signaling that price was in an intermediate-term downtrend. From July forward, ROC started moving up, indicating that the downward acceleration in price had ended and a period of price deceleration was under way. At the end of July, ROC moved above its zero line, indicating that price was starting to accelerate upward. This means that the intermediate-term trend has reversed up. As long as ROC remains above its trendline, the uptrend in price will continue. However, allow me to raise a warning flag. Since ROC is just barely above its zero line, there is a possibility of a whipsaw with ROC reversing back down. To reduce the possibility of a whipsaw, we should wait for ROC to retest its trendline and then move higher before declaring an intermediate-term trend change from down to up. For more on how to measure price acceleration and deceleration with a momentum indicator, refer to the TCA article "Momentum Indicator Measures Momentum" (July 7). |
|
| FIGURE 2: IWM, DAILY. The chart shows price chart and the 50-day simple moving average in the bottom pane and 50-day ROC in the top pane. |
| Graphic provided by: MetaStock. |
| |
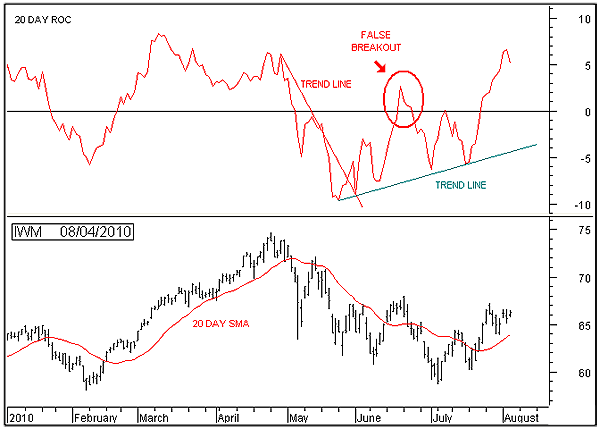
| Figure 3 shows the 20-day ROC indicator above the price chart. The 20-day ROC is used to measure the short-term trend of IWM. Note that ROC is now well above its zero line, indicating that the short-term trend is upward. Currently, price is $6.58 higher than it was 20 days ago as measured by the ROC. In addition, in early March the 20-day ROC was as much as 8.3 points above its zero line, indicating that price was $8.30 higher than it was 20 days ago. This is the highest difference between price and its price of 20 days ago over the last six months. With a current reading of 6.3, ROC is now within 20% of 8.3 ((1 - (6.58/8.3))*100), indicating that price is becoming overbought. Note also that ROC has not yet moved downward to test support of its zero line. With price now becoming overbought, expect ROC to move lower to test support from its zero line. If the zero line holds during this test, then price should continue to move higher; however, if ROC breaks down below its zero line, then the short-term uptrend is most likely over. |
|
| FIGURE 3: IWM, DAILY. The chart shows price chart and a 20-day simple moving average in the bottom pane and the 20-day ROC in the top pane. |
| Graphic provided by: MetaStock. |
| |
| In conclusion, IWM is in a critical state. It currently remains in an uptrend, but in a weak one since it is off its price peak. The intermediate term has recently turned upward but that could be a whipsaw, and the short-term uptrend is overbought. If IWM is going to survive and continue higher, the intermediate-term trend is going to have to successfully test the uptrend line of the ROC while it stays above its zero line. In addition, the short-term trend needs to work off its excesses before we can expect IWM to move higher from its current price level. However, if the intermediate-term trend, as measured by the 50-day ROC indicator, turns back down, then IWM could reverse downward over the long term. This is a critical juncture. The intermediate-term trend needs to continue higher to solidify the long-term uptrend. |
Alan Northam lives in the Dallas, Texas area and as an electronic engineer gave him an analytical mind from which he has developed a thorough knowledge of stock market technical analysis. His abilities to analyze the future direction of the stock market has allowed him to successfully trade of his own portfolio over the last 30 years. Mr. Northam is now retired and trading the stock market full time. You can reach him at inquiry@tradersclassroom.com or by visiting his website at http://www.tradersclassroom.com. You can also follow him on Twitter @TradersClassrm.
| Garland, Tx | |
| Website: | www.tradersclassroom.com |
| E-mail address: | inquiry@tradersclassroom.com |
Click here for more information about our publications!
PRINT THIS ARTICLE

Request Information From Our Sponsors
- StockCharts.com, Inc.
- Candle Patterns
- Candlestick Charting Explained
- Intermarket Technical Analysis
- John Murphy on Chart Analysis
- John Murphy's Chart Pattern Recognition
- John Murphy's Market Message
- MurphyExplainsMarketAnalysis-Intermarket Analysis
- MurphyExplainsMarketAnalysis-Visual Analysis
- StockCharts.com
- Technical Analysis of the Financial Markets
- The Visual Investor
- VectorVest, Inc.
- Executive Premier Workshop
- One-Day Options Course
- OptionsPro
- Retirement Income Workshop
- Sure-Fire Trading Systems (VectorVest, Inc.)
- Trading as a Business Workshop
- VectorVest 7 EOD
- VectorVest 7 RealTime/IntraDay
- VectorVest AutoTester
- VectorVest Educational Services
- VectorVest OnLine
- VectorVest Options Analyzer
- VectorVest ProGraphics v6.0
- VectorVest ProTrader 7
- VectorVest RealTime Derby Tool
- VectorVest Simulator
- VectorVest Variator
- VectorVest Watchdog