HOT TOPICS LIST
- MACD
- Fibonacci
- RSI
- Gann
- ADXR
- Stochastics
- Volume
- Triangles
- Futures
- Cycles
- Volatility
- ZIGZAG
- MESA
- Retracement
- Aroon
INDICATORS LIST
LIST OF TOPICS
PRINT THIS ARTICLE
by Donald W. Pendergast, Jr.
Daily and intraday charts both suggest that the line of least resistance for the premier small-cap index is toward higher prices.
Position: N/A
Donald W. Pendergast, Jr.
Donald W. Pendergast is a financial markets consultant who offers specialized services to stock brokers and high net worth individuals who seek a better bottom line for their portfolios.
PRINT THIS ARTICLE
TRIANGLES
Russell 2000 Ready To Rise?
08/05/10 08:33:05 AMby Donald W. Pendergast, Jr.
Daily and intraday charts both suggest that the line of least resistance for the premier small-cap index is toward higher prices.
Position: N/A
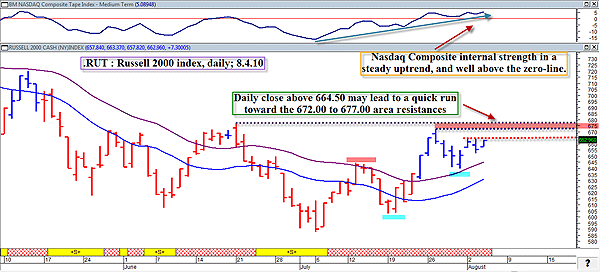
| Bear market blues, summer doldrums, dog days of summer — call it what you will, but it's hard to ignore the compelling evidence that we may be getting close to a bullish breakout in the Russell 2000. We'll take a look at the daily chart first (Figure 1), followed by a very intriguing 30-minute chart of the September emini Russell 2000 futures contract. |

|
| FIGURE 1: RUT, DAILY. Bullish trend and internal market strength (advances/declines, new highs/new lows, up volume/down volume, and so forth) characterizes this daily Russell 2000 index graph. A breakout above 664.50 gets the ball rolling. |
| Graphic provided by: MetaStock. |
| Graphic provided by: CS Scientific Expert Advisor from MetaStock. |
| |
| Yes, the economy is still a shambles, the country is drowning in red ink and unfunded liabilities and the real unemployment rate may actually be higher than the 10% figure commonly touted by the politicos. The stock market frequently turns and breaks higher, typically six to 12 months before unemployment rates begin to fall in earnest. Earnings have been coming in better than expected this past quarter, and the charts of all the major US stock indexes are in a prime position to launch to higher levels — perhaps within the next week or so. Glancing at the daily chart of the R2K, I really can't find a bearish bone to pick on. The sequence of higher highs/higher lows is intact, prices are comfortably above the 20-period simple moving average combination (the top average uses the daily highs in its calculation, while the lower one uses the daily lows — makes a great trend confirmation indicator in many cases, like right now), and the NASDAQ Composite internal strength indicator (top part of chart) is also in a steady bullish attitude. This is really just another example of "forget your personal biases, just look at the chart." In this case, the chart's lookin' good, indeed. |

|
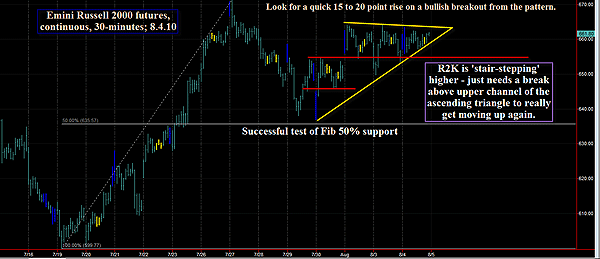
| FIGURE 2: EMINI, 30-MINUTE. A closer look of the same index, this time using a 30-minute chart. A bullish consolidation pattern within a larger ascending triangle pattern is normally thought to be an early warning of a sizable move higher out of such combined patterns. |
| Graphic provided by: TradeStation. |
| |
| Figure 2 is the 30-minute chart of the September 2010 emini Russell 2000 chart. After making a stupendous, nearly nonstop run from the 600.00 zone all the way up toward the 670 area in less than a week, the R2K needed to digest some of those gains, pulling back to the Fibonacci 50% support level before gradually stepping higher to its current location within an extremely bullish looking consolidation pattern. That pattern is giving every indication that it wants to morph into a continuation move higher, perhaps tacking on a quick 15 to 20 points (based on a measured move out of the well-defined consolidation) in relatively short order if the pattern plays out in a bullish mode. The consolidation pattern is also buried within a larger ascending triangle pattern, yet another bullish omen for this key small-cap index. |
| Start looking for bullish breakouts in your favorite small-cap issues on your intraday scanning software if you see that top gold line give way in the next few sessions; you may find yourself riding a small-cap rocket-stock higher if it does. This is one of the best intraday/daily setups I've seen all year, so keep a close watch on it because it could make you happy — if you know how to play it correctly. |
Donald W. Pendergast is a financial markets consultant who offers specialized services to stock brokers and high net worth individuals who seek a better bottom line for their portfolios.
| Title: | Writer, market consultant |
| Company: | Linear Trading Systems LLC |
| Jacksonville, FL 32217 | |
| Phone # for sales: | 904-239-9564 |
| E-mail address: | lineartradingsys@gmail.com |
Traders' Resource Links | |
| Linear Trading Systems LLC has not added any product or service information to TRADERS' RESOURCE. | |
Click here for more information about our publications!
PRINT THIS ARTICLE

Request Information From Our Sponsors
- StockCharts.com, Inc.
- Candle Patterns
- Candlestick Charting Explained
- Intermarket Technical Analysis
- John Murphy on Chart Analysis
- John Murphy's Chart Pattern Recognition
- John Murphy's Market Message
- MurphyExplainsMarketAnalysis-Intermarket Analysis
- MurphyExplainsMarketAnalysis-Visual Analysis
- StockCharts.com
- Technical Analysis of the Financial Markets
- The Visual Investor
- VectorVest, Inc.
- Executive Premier Workshop
- One-Day Options Course
- OptionsPro
- Retirement Income Workshop
- Sure-Fire Trading Systems (VectorVest, Inc.)
- Trading as a Business Workshop
- VectorVest 7 EOD
- VectorVest 7 RealTime/IntraDay
- VectorVest AutoTester
- VectorVest Educational Services
- VectorVest OnLine
- VectorVest Options Analyzer
- VectorVest ProGraphics v6.0
- VectorVest ProTrader 7
- VectorVest RealTime Derby Tool
- VectorVest Simulator
- VectorVest Variator
- VectorVest Watchdog
