HOT TOPICS LIST
- MACD
- Fibonacci
- RSI
- Gann
- ADXR
- Stochastics
- Volume
- Triangles
- Futures
- Cycles
- Volatility
- ZIGZAG
- MESA
- Retracement
- Aroon
INDICATORS LIST
LIST OF TOPICS
PRINT THIS ARTICLE
by Chaitali Mohile
After a long descending rally, the Oil Services Index looks like it could undergo a robust bullish breakout.
Position: Buy
Chaitali Mohile
Active trader in the Indian stock markets since 2003 and a full-time writer. Trading is largely based upon technical analysis.
PRINT THIS ARTICLE
TRIANGLES
$OSX Ready For Breakout
08/04/10 12:16:30 PMby Chaitali Mohile
After a long descending rally, the Oil Services Index looks like it could undergo a robust bullish breakout.
Position: Buy
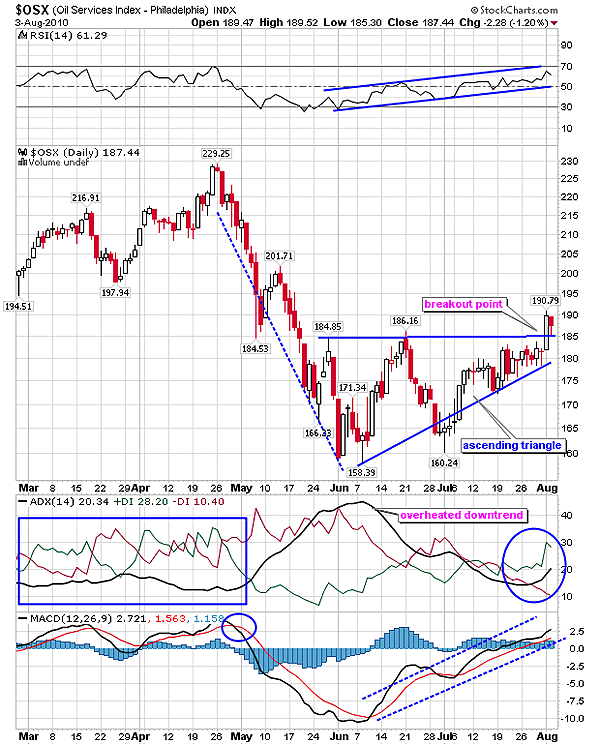
| The Oil Services Index ($OSX) plunged from 230 to 160 levels in a time span of one and a half months. The fall was steady and fast for this index. Technically, a weak trend could have been a possible reason for the sudden correction. In March and April 2010, the average directional index (ADX) (14) was below 20 levels, the buying and selling pressures reflected by the positive directional index (+DI) and negative directional index (-DI), respectively, were frequently converging. This indicated the weak trend and high volatility. But as the downside journey began, the selling pressure increased and the ADX (14) surged above 20 levels in Figure 1, developing a bearish trend. Gradually, the trend developed stronger and the bearish strength indicated by the relative strength index (RSI) (14) also turned stronger. The moving average convergence/divergence (MACD) (12,26,9) slipped into negative territory. Thus, the rally was fully loaded with the bearish strength. |

|
| FIGURE 1: $OSX, DAILY The triangle is formed at the bottom of the bearish rally, and the downtrend is overheated; thus, $OSX is about to break out upward. |
| Graphic provided by: StockCharts.com. |
| |
| Later, $OSX established support at 160 levels and initiated a fresh trend reversal rally. We can see that in Figure 1, $OSX formed higher lows and steady highs. The pattern looks like an ascending triangle at the lower levels. An ascending triangle is a bullish continuation pattern in an existing uptrend but in the downtrend the pattern is considered a trend reversal. Sometimes, the triangle also resembles a bearish flag, but in Figure 1 the flag is ascending, and hence, a bearish flag & pennant formation is ruled out. In Figure 1, the pattern occurred after the prolonged descending rally and in an overheated downtrend. Therefore, we consider the triangle to be a downtrend reversal. |
| The bullish breakout of $OSX would generate fresh demand. The ADX (14) is ready to move above 20 levels, indicating a developing uptrend, the RSI (14) has established support at 50 levels, and the MACD (12,26,9) has moved above the zero line in positive territory. Hence, the bullish breakout would definitely sustain at the upper trendline support. After the breakout, $OSX would meet a potential target of 185 - 160 = 25 (the length of the triangle) +185 (breakout level) = 210. |
Active trader in the Indian stock markets since 2003 and a full-time writer. Trading is largely based upon technical analysis.
| Company: | Independent |
| Address: | C1/3 Parth Indraprasth Towers. Vastrapur |
| Ahmedabad, Guj 380015 | |
| E-mail address: | chaitalimohile@yahoo.co.in |
Traders' Resource Links | |
| Independent has not added any product or service information to TRADERS' RESOURCE. | |
Click here for more information about our publications!
PRINT THIS ARTICLE

|

Request Information From Our Sponsors
- VectorVest, Inc.
- Executive Premier Workshop
- One-Day Options Course
- OptionsPro
- Retirement Income Workshop
- Sure-Fire Trading Systems (VectorVest, Inc.)
- Trading as a Business Workshop
- VectorVest 7 EOD
- VectorVest 7 RealTime/IntraDay
- VectorVest AutoTester
- VectorVest Educational Services
- VectorVest OnLine
- VectorVest Options Analyzer
- VectorVest ProGraphics v6.0
- VectorVest ProTrader 7
- VectorVest RealTime Derby Tool
- VectorVest Simulator
- VectorVest Variator
- VectorVest Watchdog
- StockCharts.com, Inc.
- Candle Patterns
- Candlestick Charting Explained
- Intermarket Technical Analysis
- John Murphy on Chart Analysis
- John Murphy's Chart Pattern Recognition
- John Murphy's Market Message
- MurphyExplainsMarketAnalysis-Intermarket Analysis
- MurphyExplainsMarketAnalysis-Visual Analysis
- StockCharts.com
- Technical Analysis of the Financial Markets
- The Visual Investor
