HOT TOPICS LIST
- MACD
- Fibonacci
- RSI
- Gann
- ADXR
- Stochastics
- Volume
- Triangles
- Futures
- Cycles
- Volatility
- ZIGZAG
- MESA
- Retracement
- Aroon
INDICATORS LIST
LIST OF TOPICS
PRINT THIS ARTICLE
by David Penn
While the Semiconductor index starts to round over, shares of Conexant Systems start to head south.
Position: N/A
David Penn
Technical Writer for Technical Analysis of STOCKS & COMMODITIES magazine, Working-Money.com, and Traders.com Advantage.
PRINT THIS ARTICLE
HEAD & SHOULDERS
Conexant Systems' Head and Shoulders Top
01/10/02 11:55:03 AMby David Penn
While the Semiconductor index starts to round over, shares of Conexant Systems start to head south.
Position: N/A
| One of the more valuable trading axioms I've come across may well be the dictum: Buy the strong and short the weak. In other words, if you are looking to go long equities, the best approach is to buy shares in the best companies you can afford. Assuming that your decision to go long is based at least in part by underlying bullish market action, the theory of buying the strong further assumes that in a generally bullish environment, the best companies will outperform not only the mediocre and bad companies, but also will possibly outperform the market itself. The virtues of equity diversification notwithstanding, while the Nasdaq 100 returned a little over 100% in 1999, Cisco returned in excess of 125%. |
| With the rally in the Nasdaq 100 stalled and the December highs beginning to represent topside resistance, I looked to some of the weaker stocks in the Nasdaq 100 (the QQQ components) to see if the stagnant rally in the broader index has shown up as significant weakness among the lesser stocks. What was interesting was that although some of the stronger stocks are mirroring the Nasdaq 100's inconclusive trading range, weaker stocks, such as Conexant Systems, were indeed already showing ominous signs of giving way. |

|
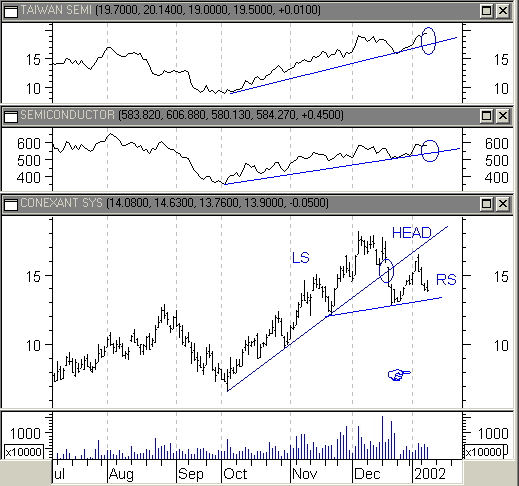
| Conexant Semiconductor's weakness may anticipate further near-term weakness in the broader semicoductor industry. |
| Graphic provided by: MetaStock. |
| |
| Conexant Systems (CNXT) is a semiconductor stock. The included chart includes both the Philadelphia Semiconductor stock index (SOX) as well as concurrent price action in one of the larger semiconductor companies, Taiwan Semiconductor (TSM). Note how both TSM and the semiconductor index are moving almost completely in tandem. Both feature upwardly sloping trendlines that are unbroken as of this writing. In mid-December, both the TSM and the SOX rallied from contact with these trendlines and currently look as if these rallies are, at a minimum, leveling off. Additionally, both Taiwan Semiconductor and the Philadelphia Semiconductor stock index look to be retreating from tests of the December highs, making a regress to the trendline-- and short-term price weakness-- increasingly likely. |
| However, the situation with Conexant Systems appears more precarious. The same upward trendline that guided the semiconductors to their present highs was broken by CNXT in mid-December. But where Taiwan Semiconductor and the SOX rallied from the mid-December decline, CNXT continued to decline, finally finding support at the previous correction low in mid-November. CNXT did eventually rally in the second half of December. Unfortunately, CNXT's test of its December high quickly proved to be unsuccessful (recall that, of this writing, the jury was still out on the tests for Taiwan Semiconductor and the SOX), and CNXT again retreated to a previous correction low. |
| This price action has CNXT in a head and shoulders top, with a peak of about 18 and an upwardly sloping neckline at about 13. A chart pattern of these dimensions would suggest a downside move beneath the neckline of about 5 points, making for a downside target of 8. There is significant amount of support in this area, with minor correction lows at 10 and 9.5 before the October (pre-rally) low of 6.5. A decline of those proportions may not be likely, particularly if the stronger semiconductor stocks and the index itself rally from the trendline, toward which they seem to be headed. Nevertheless, a minor correction in a continuing rally for the strong stocks, may still allow for opportunities on the short side for the weak. |
Technical Writer for Technical Analysis of STOCKS & COMMODITIES magazine, Working-Money.com, and Traders.com Advantage.
| Title: | Technical Writer |
| Company: | Technical Analysis, Inc. |
| Address: | 4757 California Avenue SW |
| Seattle, WA 98116 | |
| Phone # for sales: | 206 938 0570 |
| Fax: | 206 938 1307 |
| Website: | www.Traders.com |
| E-mail address: | DPenn@traders.com |
Traders' Resource Links | |
| Charting the Stock Market: The Wyckoff Method -- Books | |
| Working-Money.com -- Online Trading Services | |
| Traders.com Advantage -- Online Trading Services | |
| Technical Analysis of Stocks & Commodities -- Publications and Newsletters | |
| Working Money, at Working-Money.com -- Publications and Newsletters | |
| Traders.com Advantage -- Publications and Newsletters | |
| Professional Traders Starter Kit -- Software | |
Click here for more information about our publications!
PRINT THIS ARTICLE

Request Information From Our Sponsors
- VectorVest, Inc.
- Executive Premier Workshop
- One-Day Options Course
- OptionsPro
- Retirement Income Workshop
- Sure-Fire Trading Systems (VectorVest, Inc.)
- Trading as a Business Workshop
- VectorVest 7 EOD
- VectorVest 7 RealTime/IntraDay
- VectorVest AutoTester
- VectorVest Educational Services
- VectorVest OnLine
- VectorVest Options Analyzer
- VectorVest ProGraphics v6.0
- VectorVest ProTrader 7
- VectorVest RealTime Derby Tool
- VectorVest Simulator
- VectorVest Variator
- VectorVest Watchdog
- StockCharts.com, Inc.
- Candle Patterns
- Candlestick Charting Explained
- Intermarket Technical Analysis
- John Murphy on Chart Analysis
- John Murphy's Chart Pattern Recognition
- John Murphy's Market Message
- MurphyExplainsMarketAnalysis-Intermarket Analysis
- MurphyExplainsMarketAnalysis-Visual Analysis
- StockCharts.com
- Technical Analysis of the Financial Markets
- The Visual Investor
