HOT TOPICS LIST
- MACD
- Fibonacci
- RSI
- Gann
- ADXR
- Stochastics
- Volume
- Triangles
- Futures
- Cycles
- Volatility
- ZIGZAG
- MESA
- Retracement
- Aroon
INDICATORS LIST
LIST OF TOPICS
PRINT THIS ARTICLE
by Koos van der Merwe
On June 28, I wrote an article stating that I believed that the Dow Jones Industrial Average was completing a Wave II correction. How accurate was I in my forecast?
Position: Accumulate
Koos van der Merwe
Has been a technical analyst since 1969, and has worked as a futures and options trader with First Financial Futures in Johannesburg, South Africa.
PRINT THIS ARTICLE
ELLIOTT WAVE
Bull Or Bear Update
08/02/10 10:15:04 AMby Koos van der Merwe
On June 28, I wrote an article stating that I believed that the Dow Jones Industrial Average was completing a Wave II correction. How accurate was I in my forecast?
Position: Accumulate
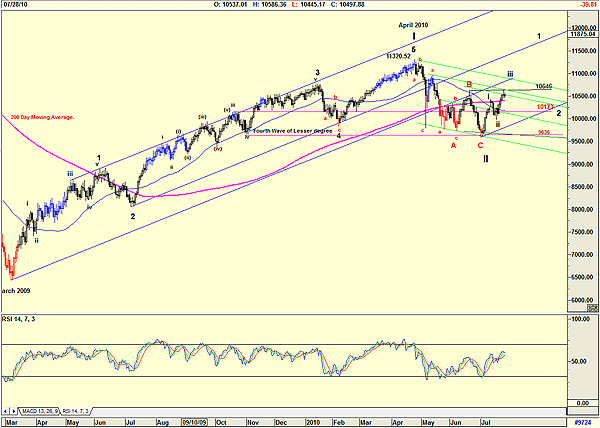
| In that article, I wrote how surprised I was at how quickly what I felt was a Wave II correction fell. This should not have surprised me. Bear corrections always occur twice as fast as a bull market rises. This is standard Elliott wave technique. A wave 2 correction also falls to the fourth wave of lesser degree. This is a standard Wave 2 rule. So let us look at the first chart. |

|
| FIGURE 1: DJIA WAVE COUNT |
| Graphic provided by: AdvancedGET. |
| |
| Figure 1 shows how the Dow Jones Industrial Average (DJIA) reached a high of 11,320.52 in April 2010 and then corrected in an abcxabc pattern to find Wave A of Wave II, rose in a Wave B of Wave II and then fell without any correction in a Wave C of Wave II, finding its bottom at 9636, the lower level of the fourth wave of lesser degree. This is disturbing, because a Wave C should trace a five-wave correction, or a three-wave abc correction. It is unusual to have a direct correction as shown on the chart. |

|
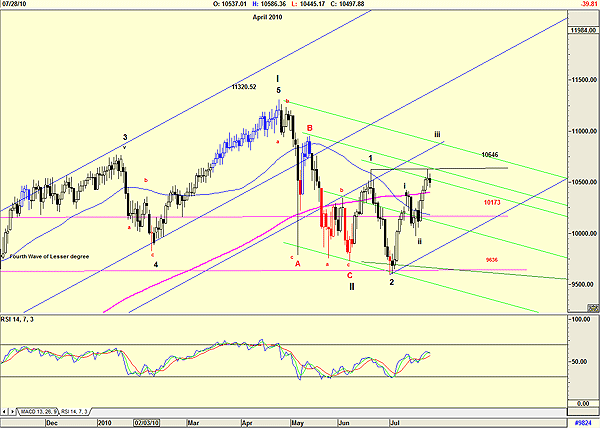
| FIGURE 2: DJIA ALTERNATE COUNT |
| Graphic provided by: AdvancedGET. |
| |
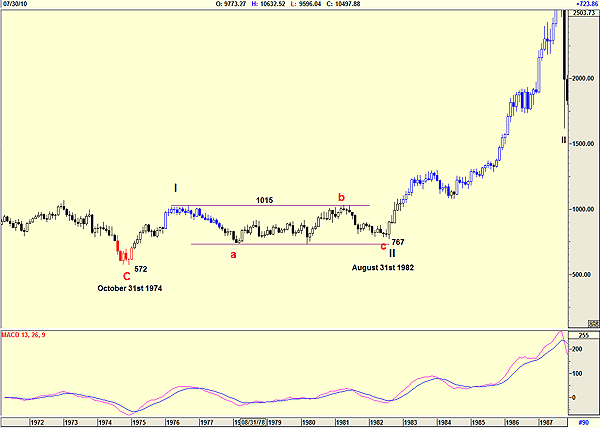
| This leads me to believe the pattern can be a pattern shown in Figure 2, where Wave ii corrected lower that the low of Wave C. Unusual, but it is a pattern I have seen before, especially when bears overreact. With many investors staying clear of the market, scared of a double-dip recession, this is a very strong possibility and confirms the thought that the recovery over the coming years will be a slow and cautious one as seen in Figure 3, a monthly chart of the DJIA showing how the index traded in a sideways pattern from 1974 to 1982, a period of eight years, before taking off. |

|
| FIGURE 3: DJIA, 1974 TO 1982 |
| Graphic provided by: AdvancedGET. |
| |
| Many can argue that over this period, the DJIA increased from 572 to 1015, a rise of 77%. Nice, if you were bullish at 572. Not so nice if being overly cautious as investors are today, you bought at or close to the 1015 level, as most investors probably did. For investors to buy at 572, they have to be brave and feel justified in their fear when they see the DJIA fall to 767, with bears waving flags of joy. I can only say that we should follow the example of John Templeton and use any correction to buy 100 shares of those stocks you would like to own and hold for the long term. Yes, the DJIA is in a bull market, but it will be slow and painful. Far too much doom and gloom out there. |
Has been a technical analyst since 1969, and has worked as a futures and options trader with First Financial Futures in Johannesburg, South Africa.
| Address: | 3256 West 24th Ave |
| Vancouver, BC | |
| Phone # for sales: | 6042634214 |
| E-mail address: | petroosp@gmail.com |
Click here for more information about our publications!
Comments
Date: 08/03/10Rank: 5Comment:

Request Information From Our Sponsors
- StockCharts.com, Inc.
- Candle Patterns
- Candlestick Charting Explained
- Intermarket Technical Analysis
- John Murphy on Chart Analysis
- John Murphy's Chart Pattern Recognition
- John Murphy's Market Message
- MurphyExplainsMarketAnalysis-Intermarket Analysis
- MurphyExplainsMarketAnalysis-Visual Analysis
- StockCharts.com
- Technical Analysis of the Financial Markets
- The Visual Investor
- VectorVest, Inc.
- Executive Premier Workshop
- One-Day Options Course
- OptionsPro
- Retirement Income Workshop
- Sure-Fire Trading Systems (VectorVest, Inc.)
- Trading as a Business Workshop
- VectorVest 7 EOD
- VectorVest 7 RealTime/IntraDay
- VectorVest AutoTester
- VectorVest Educational Services
- VectorVest OnLine
- VectorVest Options Analyzer
- VectorVest ProGraphics v6.0
- VectorVest ProTrader 7
- VectorVest RealTime Derby Tool
- VectorVest Simulator
- VectorVest Variator
- VectorVest Watchdog
