HOT TOPICS LIST
- MACD
- Fibonacci
- RSI
- Gann
- ADXR
- Stochastics
- Volume
- Triangles
- Futures
- Cycles
- Volatility
- ZIGZAG
- MESA
- Retracement
- Aroon
INDICATORS LIST
LIST OF TOPICS
PRINT THIS ARTICLE
by Chaitali Mohile
The breakout of XLI is likely to initiate a fresh bullish trend.
Position: Buy
Chaitali Mohile
Active trader in the Indian stock markets since 2003 and a full-time writer. Trading is largely based upon technical analysis.
PRINT THIS ARTICLE
TECHNICAL INDICATORS
XLI In New Uptrend
08/03/10 12:14:26 PMby Chaitali Mohile
The breakout of XLI is likely to initiate a fresh bullish trend.
Position: Buy
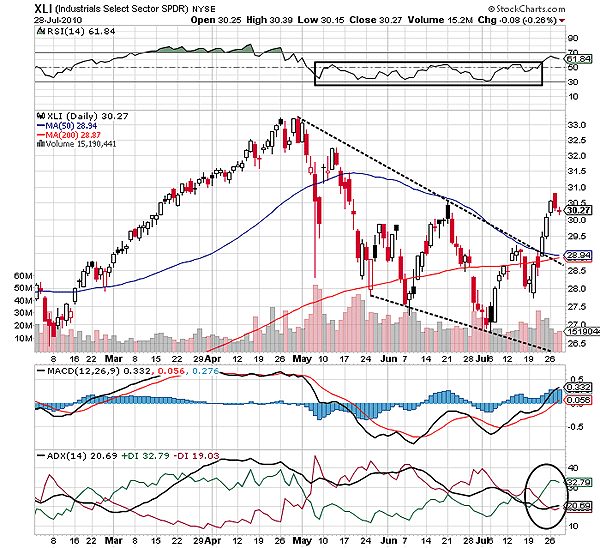
| Recently, the Industrial Select SPDR (XLI) broke upward from a falling wedge -- a bullish reversal pattern. The breakout had a robust bullish strength as price breached the converging 50-day and 200-day moving average (MA) resistance as well. This breakout was a real trend reversal for XLI. The relative strength index (RSI) (14) that was stuck between the 50 and 30 levels slipped into the bullish region, indicating a developing strength in rally. The volatile moving average convergence/divergence (MACD) (12,26,9) turned positive and shifted in positive territory above the zero line. Thus, the bullish rally began on fresh positive momentum. |

|
| FIGURE 1: XLI, DAILY. The series of lower highs and lower lows formed the falling wedge. Since the trading range was very wide, the pattern broke upward before the maturity. |
| Graphic provided by: StockCharts.com. |
| |
| Most important, the buying pressure indicated by the positive directional index (+DI) (green line) of the average directional index (ADX) (14) moved north, dragging the trend in favor of the bulls. Although the ADX (14) has just touched 20 levels, the increased buying pressure would definitely pull the indicator higher. The three white candles in the price chart of Figure 1 show the three white soldiers' candlestick formation, confirming the trend reversal possibility. The following red candle and the doji would not harm the robust rally as all the three indicators are bullish, but we could see a consolidation ahead. Therefore, traders can remain long in XLI with the stop-loss at $29.5. |

|
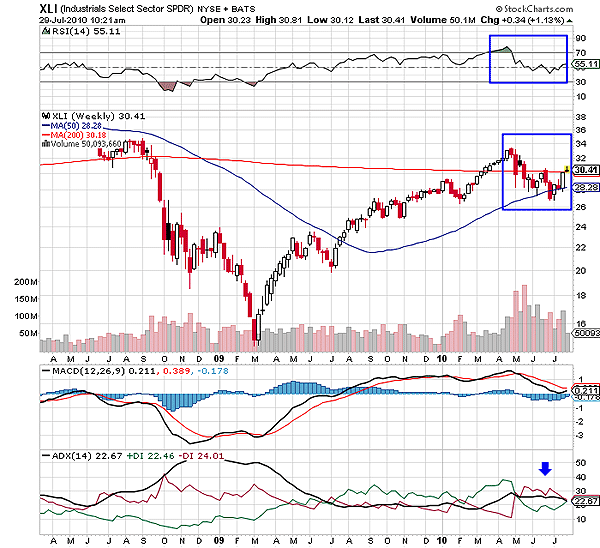
| FIGURE 2: XLI, WEEKLY. The index would soon establish support on the 200-day MA. |
| Graphic provided by: StockCharts.com. |
| |
| The medium-term chart in Figure 2 also shows healthy picture of XLI. The index is ready to convert the 200-day MA resistance to support and has the strong support of the 50-day MA. For the last few weeks, the sector index was stuck between the two MAs. But you do see signs of a MA breakout which is supported by the positive momentum reflected by the MACD (12,26,9). The RSI (14) has surged above 50 levels, suggesting a fresh buying opportunity for traders and also indicating bullish strength in the rally. |
| Thus, XLI is ready to enter the new bullish trend and open a fresh buy-set for short-term and long-term traders. |
Active trader in the Indian stock markets since 2003 and a full-time writer. Trading is largely based upon technical analysis.
| Company: | Independent |
| Address: | C1/3 Parth Indraprasth Towers. Vastrapur |
| Ahmedabad, Guj 380015 | |
| E-mail address: | chaitalimohile@yahoo.co.in |
Traders' Resource Links | |
| Independent has not added any product or service information to TRADERS' RESOURCE. | |
Click here for more information about our publications!
PRINT THIS ARTICLE

Request Information From Our Sponsors
- StockCharts.com, Inc.
- Candle Patterns
- Candlestick Charting Explained
- Intermarket Technical Analysis
- John Murphy on Chart Analysis
- John Murphy's Chart Pattern Recognition
- John Murphy's Market Message
- MurphyExplainsMarketAnalysis-Intermarket Analysis
- MurphyExplainsMarketAnalysis-Visual Analysis
- StockCharts.com
- Technical Analysis of the Financial Markets
- The Visual Investor
- VectorVest, Inc.
- Executive Premier Workshop
- One-Day Options Course
- OptionsPro
- Retirement Income Workshop
- Sure-Fire Trading Systems (VectorVest, Inc.)
- Trading as a Business Workshop
- VectorVest 7 EOD
- VectorVest 7 RealTime/IntraDay
- VectorVest AutoTester
- VectorVest Educational Services
- VectorVest OnLine
- VectorVest Options Analyzer
- VectorVest ProGraphics v6.0
- VectorVest ProTrader 7
- VectorVest RealTime Derby Tool
- VectorVest Simulator
- VectorVest Variator
- VectorVest Watchdog
