HOT TOPICS LIST
- MACD
- Fibonacci
- RSI
- Gann
- ADXR
- Stochastics
- Volume
- Triangles
- Futures
- Cycles
- Volatility
- ZIGZAG
- MESA
- Retracement
- Aroon
INDICATORS LIST
LIST OF TOPICS
PRINT THIS ARTICLE
by Donald W. Pendergast, Jr.
A new RMO swing buy signal in Bristol-Myers stock has occurred in the wake of an important test of key support.
Position: Buy
Donald W. Pendergast, Jr.
Donald W. Pendergast is a financial markets consultant who offers specialized services to stock brokers and high net worth individuals who seek a better bottom line for their portfolios.
PRINT THIS ARTICLE
TRADING SYSTEMS
A Bristol-Myers Squibb New RMO Buy Signal
08/02/10 09:43:26 AMby Donald W. Pendergast, Jr.
A new RMO swing buy signal in Bristol-Myers stock has occurred in the wake of an important test of key support.
Position: Buy
| With the market now pulling back after making a modest surge higher from the early June lows, it might be a good time to locate stocks that are at or have just successfully tested key support levels. Here's a look at an interesting long setup in Bristol-Myers Squibb (BMY), one that could also be hinting that the broad market still has some steam left to power higher well into August. |

|
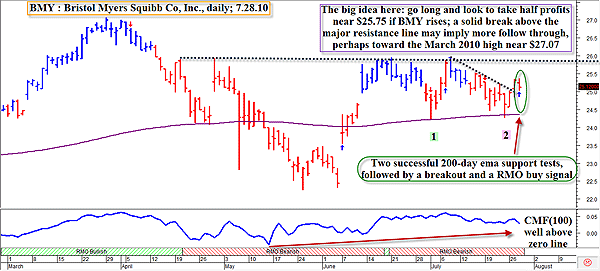
| FIGURE 1: BMY, DAILY. Any time you see a significant bullish breakout occur soon after a successful test of major support, the risk/reward ratio for new long trade entries is greatly enhanced. Always respect the 200-day EMA, anticipating the high-probability bounces that frequently occur off of it in either direction. |
| Graphic provided by: MetaStock. |
| Graphic provided by: Rahul Mohindar indicators from MetaStock 11. |
| |
| These days, most of my trading is system-based, but any time I consider a discretionary trade setup, one of my first tasks is to determine where the major support/resistance (S/R) levels are. Frequently, both the 200-day exponential moving average (EMA) and its simple moving average (SMA) cousin act as significant S/R barriers that can make setting up a trade a fairly simple proposition. Take Figure 1, a daily chart of BMY. You'll note the twin tests of 200-day EMA support (points 1 and 2), with the second test forming a higher swing low. The EMA itself is still sloping higher, another little bullish tidbit, but the real attraction is the solid breakout from the three-week pullback pattern, one that was immediately followed by a Rahul Mohindar (RMO) swing trade buy signal. For those unfamiliar with the RMO trading system in MetaStock 10 and 11, you owe it to yourself to try it out on the stocks and futures contracts you trade, as it is frequently able to identify the start of major trending moves. There is no way to backtest the RMO swing trade signals (yet) within MetaStock, which is why I always filter every signal against a more comprehensive background that includes higher time frame, trend, money flow (you can use OBV, AccDis, CMF, NVI, or PVI or similar indicators to help out here), and support/resistance levels. At the bottom of Figure 1, you can see the 100-period Chaikin money flow (CMF), which is still way above its zero line. Overall, this looks like a good trade setup, especially with the important support test already completed. |
| Note the massive resistance barrier that exists near $25.80 (horizontal dotted line); if BMY cooperates and starts to rise along with the broad market soon, this resistance level will most likely be a formidable place for price to temporarily stall and/or pull back again. As such, it would be a good place to take at least half profits on a successful run higher. However, if the broad market catches a bid and starts chugging higher again and BMY manages a couple of daily closes above $25.80, you may want to continue to trail any remaining position you have, hoping to capture larger gains. |
| What will the broad market do next? No one knows, so all we can do is trade our proven trading systems (mechanical, hybrid, or purely discretionary), follow our rules, and anticipate a successful outcome. If you like to trade from the hybrid trading model (that is, a mode of trading where a mechanical buy/sell signal is further filtered through the lens of other critical technical and/or fundamental data), the simple technical filters described in this article may help you to further refine and perfect your own unique style of trading. |
Donald W. Pendergast is a financial markets consultant who offers specialized services to stock brokers and high net worth individuals who seek a better bottom line for their portfolios.
| Title: | Writer, market consultant |
| Company: | Linear Trading Systems LLC |
| Jacksonville, FL 32217 | |
| Phone # for sales: | 904-239-9564 |
| E-mail address: | lineartradingsys@gmail.com |
Traders' Resource Links | |
| Linear Trading Systems LLC has not added any product or service information to TRADERS' RESOURCE. | |
Click here for more information about our publications!
Comments

Request Information From Our Sponsors
- StockCharts.com, Inc.
- Candle Patterns
- Candlestick Charting Explained
- Intermarket Technical Analysis
- John Murphy on Chart Analysis
- John Murphy's Chart Pattern Recognition
- John Murphy's Market Message
- MurphyExplainsMarketAnalysis-Intermarket Analysis
- MurphyExplainsMarketAnalysis-Visual Analysis
- StockCharts.com
- Technical Analysis of the Financial Markets
- The Visual Investor
- VectorVest, Inc.
- Executive Premier Workshop
- One-Day Options Course
- OptionsPro
- Retirement Income Workshop
- Sure-Fire Trading Systems (VectorVest, Inc.)
- Trading as a Business Workshop
- VectorVest 7 EOD
- VectorVest 7 RealTime/IntraDay
- VectorVest AutoTester
- VectorVest Educational Services
- VectorVest OnLine
- VectorVest Options Analyzer
- VectorVest ProGraphics v6.0
- VectorVest ProTrader 7
- VectorVest RealTime Derby Tool
- VectorVest Simulator
- VectorVest Variator
- VectorVest Watchdog
