HOT TOPICS LIST
- MACD
- Fibonacci
- RSI
- Gann
- ADXR
- Stochastics
- Volume
- Triangles
- Futures
- Cycles
- Volatility
- ZIGZAG
- MESA
- Retracement
- Aroon
INDICATORS LIST
LIST OF TOPICS
PRINT THIS ARTICLE
by Alan R. Northam
While there are many different methods used to determine trend, this one uses the rate of change indicator.
Position: N/A
Alan R. Northam
Alan Northam lives in the Dallas, Texas area and as an electronic engineer gave him an analytical mind from which he has developed a thorough knowledge of stock market technical analysis. His abilities to analyze the future direction of the stock market has allowed him to successfully trade of his own portfolio over the last 30 years. Mr. Northam is now retired and trading the stock market full time. You can reach him at inquiry@tradersclassroom.com or by visiting his website at http://www.tradersclassroom.com. You can also follow him on Twitter @TradersClassrm.
PRINT THIS ARTICLE
MOMENTUM
SMH Remains In Uptrend
07/28/10 08:45:42 AMby Alan R. Northam
While there are many different methods used to determine trend, this one uses the rate of change indicator.
Position: N/A
| The technology market sector is one of the sectors used as a leading indicator of the broad stock market. In particular, the Semiconductor Holdrs (SMH) exchange traded fund (ETF) is closely followed as the leading indicator of the overall stock market. When SMH moves higher the overall stock market is expected to follow, and when it moves lower the overall stock market expected to do the same. Therefore, by analyzing the trend of SMH, it is possible to determine the future trend of the broader stock market. This article uses the concepts presented in two recent pieces I wrote entitled "Momentum Indicator Measures Trend" (published June 29) and "Momentum Indicator Measures Momentum" (July 7). In addition, this article expands on those articles by using other classical technical analysis methods applied to the rate of change (ROC) indicator to determine the trend of SMH. |
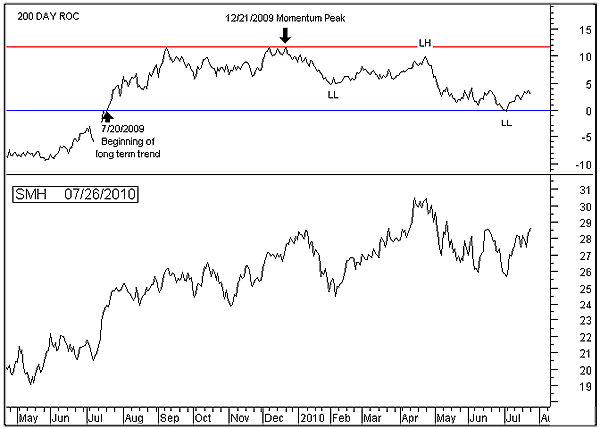
| Figure 1 shows the price chart of SMH in the bottom pane. The 200-day rate of change (ROC) indicator is shown in the upper pane. The 200-day ROC is used to measure the long-term trend and price momentum of SMH. This indicator moved above its zero line on July 20, 2009, signaling the beginning of a long-term uptrend for SMH. Note that the ROC has been above its zero line for more than one year, thus qualifying as a long-term uptrend. Note also that the ROC peaked on December 21, 2009. This peak represents the end of the price acceleration period. From December 21, 2009, until now, price has been decelerating. This deceleration has been noted by the ROC forming lower lows (LL) and lower highs (LH). Note also that the deceleration of price normally occurs before a trend reversal. The actual ending of the current long-term uptrend of SMH, however, will occur when the ROC moves below its zero line. |

|
| FIGURE 1: SMH, DAILY. This chart shows the price chart in the lower pane and the 200-day rate of change indicator in the upper pane. |
| Graphic provided by: MetaStock. |
| |
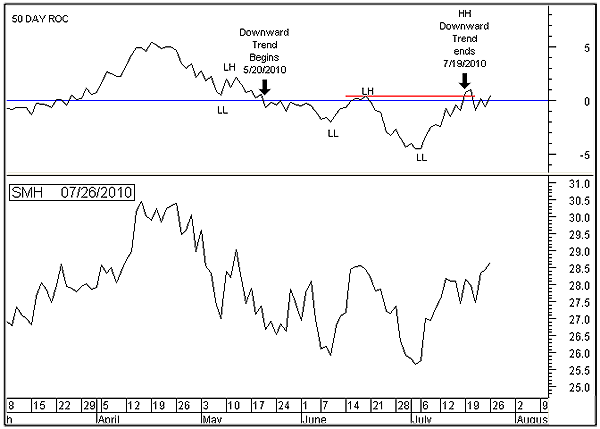
| Figure 2 shows the 50-day ROC above the price chart. The 50-day ROC is used to measure the intermediate-term trend of SMH. Note that the 50-day ROC moved below its zero line on May 20, 2010, indicating the beginning of the intermediate-term downtrend. The downtrend then moved into early July as the ROC continued making lower highs and lower lows. On July 19, 2010, however, ROC made a new higher high (HH), signaling the end of the downtrend. Note that while the intermediate-term downtrend has ended, a new uptrend has not yet begun. To start a new uptrend, ROC must first make a higher low, followed by a higher high. Therefore, since ROC is neither in an upward or downward trend, it must be considered to be in a trading range until determined otherwise. |

|
| FIGURE 2: SMH, DAILY. This chart shows the price chart in the lower pane and the 50-day ROC in the upper pane. |
| Graphic provided by: MetaStock. |
| |
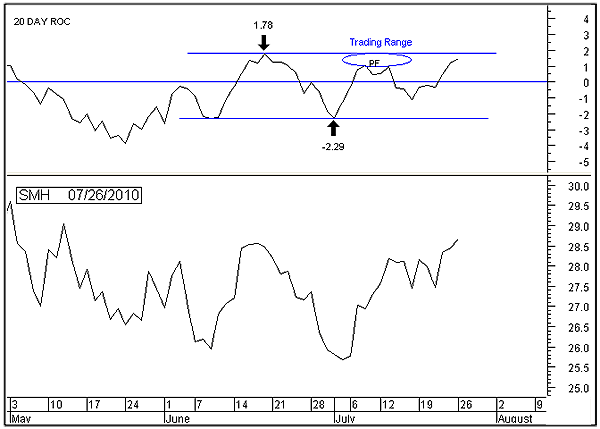
| Figure 3 shows the 20-day rate of change indicator above the price chart. The 20-day ROC is used to measure the short-term trend of SMH. The 20-day ROC has been moving above and below its zero line since mid-June, signaling that it is in a trading range with a slight bearish bias (note the highest high of the trading range was 1.78 while the lowest low was -2.29). This is the same trading range I alluded to previously, but it is easier to see in the shorter time frame. In addition, note that the rally attempt after the last low at -2.29 failed to reach the upper channel line of the trading range. This is known as a price failure and indicates buying weakness. Together, the negative bias of the trading range and the price failure suggests a breakout in the downward direction, signaling the resumption of the downtrend. |

|
| FIGURE 3: SMH, DAILY. This chart shows the price chart in the lower pane and the 20-day ROC indicator in the upper pane. |
| Graphic provided by: MetaStock. |
| |
| In conclusion, SMH remains in a long-term uptrend. However, the long-term trend has been decelerating since the end of 2009 and is now close to the same price level it was 200 days ago. Over the intermediate term and short term, SMH remains in a trading range. A breakout of the trading range is now necessary to determine the future direction of SMH. |
Alan Northam lives in the Dallas, Texas area and as an electronic engineer gave him an analytical mind from which he has developed a thorough knowledge of stock market technical analysis. His abilities to analyze the future direction of the stock market has allowed him to successfully trade of his own portfolio over the last 30 years. Mr. Northam is now retired and trading the stock market full time. You can reach him at inquiry@tradersclassroom.com or by visiting his website at http://www.tradersclassroom.com. You can also follow him on Twitter @TradersClassrm.
| Garland, Tx | |
| Website: | www.tradersclassroom.com |
| E-mail address: | inquiry@tradersclassroom.com |
Click here for more information about our publications!
PRINT THIS ARTICLE

Request Information From Our Sponsors
- StockCharts.com, Inc.
- Candle Patterns
- Candlestick Charting Explained
- Intermarket Technical Analysis
- John Murphy on Chart Analysis
- John Murphy's Chart Pattern Recognition
- John Murphy's Market Message
- MurphyExplainsMarketAnalysis-Intermarket Analysis
- MurphyExplainsMarketAnalysis-Visual Analysis
- StockCharts.com
- Technical Analysis of the Financial Markets
- The Visual Investor
- VectorVest, Inc.
- Executive Premier Workshop
- One-Day Options Course
- OptionsPro
- Retirement Income Workshop
- Sure-Fire Trading Systems (VectorVest, Inc.)
- Trading as a Business Workshop
- VectorVest 7 EOD
- VectorVest 7 RealTime/IntraDay
- VectorVest AutoTester
- VectorVest Educational Services
- VectorVest OnLine
- VectorVest Options Analyzer
- VectorVest ProGraphics v6.0
- VectorVest ProTrader 7
- VectorVest RealTime Derby Tool
- VectorVest Simulator
- VectorVest Variator
- VectorVest Watchdog
