HOT TOPICS LIST
- MACD
- Fibonacci
- RSI
- Gann
- ADXR
- Stochastics
- Volume
- Triangles
- Futures
- Cycles
- Volatility
- ZIGZAG
- MESA
- Retracement
- Aroon
INDICATORS LIST
LIST OF TOPICS
PRINT THIS ARTICLE
by Koos van der Merwe
Exchange traded funds are designed to follow the indexes. Here is a product that could be an ETF, but performs better.
Position: Buy
Koos van der Merwe
Has been a technical analyst since 1969, and has worked as a futures and options trader with First Financial Futures in Johannesburg, South Africa.
PRINT THIS ARTICLE
HEAD & SHOULDERS
Better Than The Exchange Traded Fund
07/28/10 08:12:57 AMby Koos van der Merwe
Exchange traded funds are designed to follow the indexes. Here is a product that could be an ETF, but performs better.
Position: Buy
| Blackstone (BX) is a global investment and advisory firm, and like all investment companies, trended down with the indexes. Their portfolio companies employ nearly a million people around the world, making them a major factor in world economies. Blackstone completed its initial public offering in June 2007. My charts for them, however, only go back to August 2009. |

|
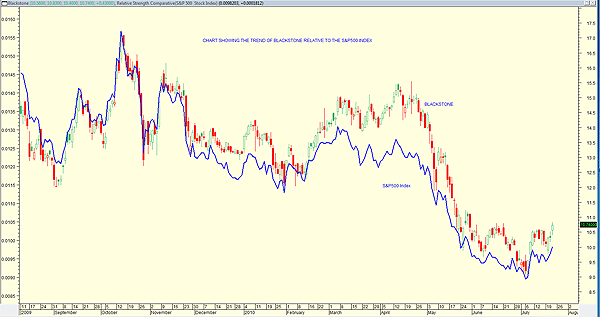
| FIGURE 1: BX VS. SPX. Relative performance of Blackstone to the S&P 500. |
| Graphic provided by: MetaStock. |
| |
| Figure 1 is a relative performance chart showing the performance of the company as compared to the Standard & Poor's 500. The chart shows how BX closely follows the trend of the S&P 500 up until November 2009, when it began to outperform the index, even though the general trend followed that of the index. This suggests that the recovery could be faster than the index. |

|
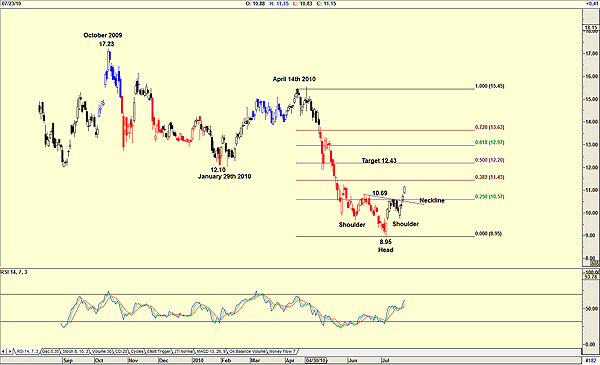
| FIGURE 2: BX, DAILY. Daily chart of Blackstone showing an inverse head & shoulders formation. |
| Graphic provided by: AdvancedGET. |
| |
| Figure 2, a daily chart of BX, shows how the ticker has formed an inverse head & shoulders pattern, suggesting a target of $12.43. The relative strength index (RSI) shown confirms the uptrend. Blackstone Group, as mentioned, is a global investment company. It is not an exchange traded fund (ETF), yet it follows the general trend of the S&P 500, and the performance chart shows that it does in fact perform better than the S&P 500. With the expected recovery in the market, if we therefore chose to follow the trend, this is a share that we could hold. |
Has been a technical analyst since 1969, and has worked as a futures and options trader with First Financial Futures in Johannesburg, South Africa.
| Address: | 3256 West 24th Ave |
| Vancouver, BC | |
| Phone # for sales: | 6042634214 |
| E-mail address: | petroosp@gmail.com |
Click here for more information about our publications!
PRINT THIS ARTICLE

Request Information From Our Sponsors
- StockCharts.com, Inc.
- Candle Patterns
- Candlestick Charting Explained
- Intermarket Technical Analysis
- John Murphy on Chart Analysis
- John Murphy's Chart Pattern Recognition
- John Murphy's Market Message
- MurphyExplainsMarketAnalysis-Intermarket Analysis
- MurphyExplainsMarketAnalysis-Visual Analysis
- StockCharts.com
- Technical Analysis of the Financial Markets
- The Visual Investor
- VectorVest, Inc.
- Executive Premier Workshop
- One-Day Options Course
- OptionsPro
- Retirement Income Workshop
- Sure-Fire Trading Systems (VectorVest, Inc.)
- Trading as a Business Workshop
- VectorVest 7 EOD
- VectorVest 7 RealTime/IntraDay
- VectorVest AutoTester
- VectorVest Educational Services
- VectorVest OnLine
- VectorVest Options Analyzer
- VectorVest ProGraphics v6.0
- VectorVest ProTrader 7
- VectorVest RealTime Derby Tool
- VectorVest Simulator
- VectorVest Variator
- VectorVest Watchdog
