HOT TOPICS LIST
- MACD
- Fibonacci
- RSI
- Gann
- ADXR
- Stochastics
- Volume
- Triangles
- Futures
- Cycles
- Volatility
- ZIGZAG
- MESA
- Retracement
- Aroon
INDICATORS LIST
LIST OF TOPICS
PRINT THIS ARTICLE
by Chaitali Mohile
The candlestick patterns and indicators could help us identify the breakout point.
Position: Sell
Chaitali Mohile
Active trader in the Indian stock markets since 2003 and a full-time writer. Trading is largely based upon technical analysis.
PRINT THIS ARTICLE
TECHNICAL ANALYSIS
Eagle Material Eager To Break Out
07/28/10 08:54:42 AMby Chaitali Mohile
The candlestick patterns and indicators could help us identify the breakout point.
Position: Sell
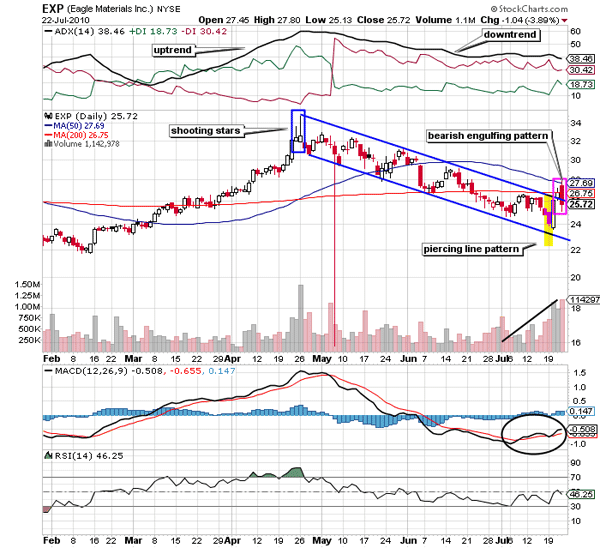
| Two shooting star candlestick patterns and a highly overheated uptrend ended an advance rally of Eagle Material (EXP). The shooting star is a single candlestick bearish reversal formation that reverses a well-developed bullish trend. The average directional movement index (ADX) (14) in Figure 1 was ready to plunge from the 60 levels, thus confirming the bearish reversal candlestick pattern. The cluster of two shooting stars in Figure 1 made the downward rally more powerful; as a result, the correction formed a perfect descending channel. The channel acted as resistance for EXP and offered safe entry and exit opportunities for traders. Gradually, an overbought relative strength index (RSI) (14) and positive moving average convergence/divergence (MACD) (12,26,9) slipped into the bearish zone, encouraging the declining rally. |
| EXP tumbled below the 50-day and 200-day moving average (MA) supports. At the end of the channel we can see a piercing line candlestick pattern. In this pattern the bullish candle pierced more than half into the prior red bearish candles. We can see that the bullish candle in the yellow block opened below the low of the previous day's close and later surged higher. Since the pattern is a bullish formation, EXP bounced on this signal and hit the upper trendline resistance. Accordingly, the volume rose and the MACD (12,26,9) underwent a bullish crossover in its negative region. Let's see what the other two indicators were doing. The RSI (14) looked reluctant to cross the center line at 50 levels, and the descending ADX (14) indicated a well-developed downtrend. So the candlestick pattern in isolation cannot twist the robust bearish rally. The bearish engulfing pattern in the purple box signifies the strength of the indicators and ignores the piercing line pattern. |

|
| FIGURE 1: EXP, DAILY |
| Graphic provided by: StockCharts.com. |
| |
| Another reason for the failure of the bullish breakout is the 200-day MA resistance. We can see in Figure 1 that the descent has marginally breached upward, but the MA resistance suppressed the rally, forming the bearish engulfing pattern. The indicators are neither completely bullish nor bearish to initiate a fresh bullish breakout journey. Thus, EXP is likely to continue its downward movement within the channel for the next few weeks. Traders can trigger long positions if EXP breaches the MA resistance and sustain the newly formed support. In addition, they should also keep an eye on the indicators to avoid any whipsaws. |
Active trader in the Indian stock markets since 2003 and a full-time writer. Trading is largely based upon technical analysis.
| Company: | Independent |
| Address: | C1/3 Parth Indraprasth Towers. Vastrapur |
| Ahmedabad, Guj 380015 | |
| E-mail address: | chaitalimohile@yahoo.co.in |
Traders' Resource Links | |
| Independent has not added any product or service information to TRADERS' RESOURCE. | |
Click here for more information about our publications!
Comments

Request Information From Our Sponsors
- StockCharts.com, Inc.
- Candle Patterns
- Candlestick Charting Explained
- Intermarket Technical Analysis
- John Murphy on Chart Analysis
- John Murphy's Chart Pattern Recognition
- John Murphy's Market Message
- MurphyExplainsMarketAnalysis-Intermarket Analysis
- MurphyExplainsMarketAnalysis-Visual Analysis
- StockCharts.com
- Technical Analysis of the Financial Markets
- The Visual Investor
- VectorVest, Inc.
- Executive Premier Workshop
- One-Day Options Course
- OptionsPro
- Retirement Income Workshop
- Sure-Fire Trading Systems (VectorVest, Inc.)
- Trading as a Business Workshop
- VectorVest 7 EOD
- VectorVest 7 RealTime/IntraDay
- VectorVest AutoTester
- VectorVest Educational Services
- VectorVest OnLine
- VectorVest Options Analyzer
- VectorVest ProGraphics v6.0
- VectorVest ProTrader 7
- VectorVest RealTime Derby Tool
- VectorVest Simulator
- VectorVest Variator
- VectorVest Watchdog
