HOT TOPICS LIST
- MACD
- Fibonacci
- RSI
- Gann
- ADXR
- Stochastics
- Volume
- Triangles
- Futures
- Cycles
- Volatility
- ZIGZAG
- MESA
- Retracement
- Aroon
INDICATORS LIST
LIST OF TOPICS
PRINT THIS ARTICLE
by Chaitali Mohile
Should you continue to hold long positions in Southern Co., or is it time to book profits?
Position: Hold
Chaitali Mohile
Active trader in the Indian stock markets since 2003 and a full-time writer. Trading is largely based upon technical analysis.
PRINT THIS ARTICLE
CHART ANALYSIS
Southern Co. At 52-Week High
07/27/10 02:08:50 PMby Chaitali Mohile
Should you continue to hold long positions in Southern Co., or is it time to book profits?
Position: Hold
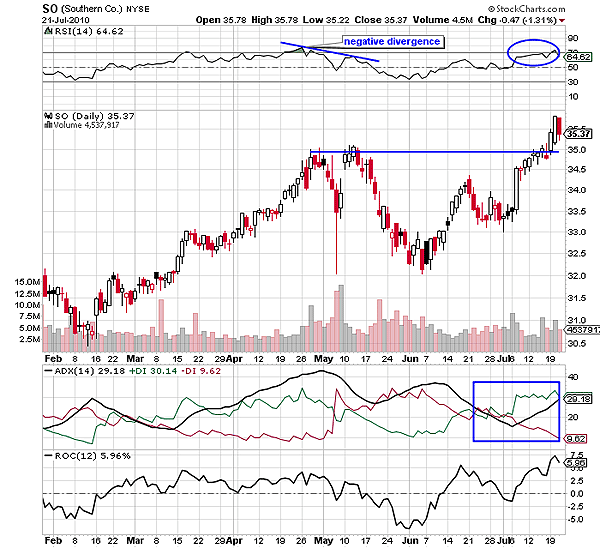
| The negative divergence between the relative strength index (RSI) (14) and price (Figure 1) was an indication that the bullish rally of Southern Co. (SO) could be coming to an end. The stock tumbled to $32, reversing an overheated uptrend. The descending average directional movement index (ADX) (14) from the 40 levels encouraged sellers to open new short positions with an immediate target for $32. The long lower shadow (spike) that formed in early May developed a support zone at 32 levels. You can see that the stock retraced to the same level and established support. A new rally was initiated from this point. SO began a fresh bullish journey with an ascending RSI (14). The stock rallied with positive momentum, as indicated by the rate of change (ROC). The indicator shifted from negative to positive region above the center line, showing that the stock witnessed a wide price change. |

|
| FIGURE 1: SO, DAILY. The stock violated the previous high resistance at $35. |
| Graphic provided by: StockCharts.com. |
| |
| Thereafter, the stock continued to move toward the previous resistance at $35. The small candles with upper and lower shadows show the decreasing bullish participation and reluctance in violating the resistance line. However, the developing uptrend and high volume helped convert the previous high resistance to support. After the breakout, SO made a 52-week high. Normally, most stocks or indexes correct a few points from the new high, and SO is likely to behave in a similar manner. The RSI (14) is unable to sustain in the highly overbought region above 70 levels; the ROC (12) tipped down in positive territory but the uptrend is developing. In such circumstances, SO would plunge a few points below the support at $35. However, the bullish hold on the rally would sustain. |

|
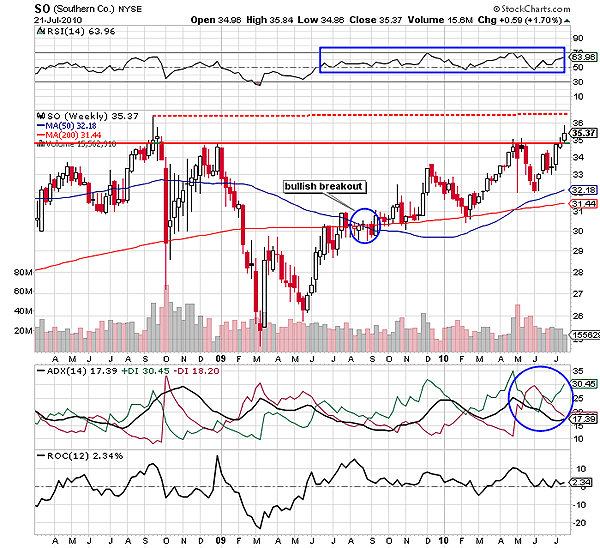
| FIGURE 2: SO, WEEKLY. After the bullish breakout, SO followed the 50-day and 200-day MA support. |
| Graphic provided by: StockCharts.com. |
| |
| According to the weekly time frame in Figure 2, SO has moved much closer to its historical high of $36. The high made by a shooting star candlestick pattern in October 2008 is likely to be a major hurdle for future rallies (dotted red line). The earlier resistance at $35 marked by the support-resistance tool line has turned to support. The RSI (14) is moving with the support of the center line; ROC (12) also has the support, and ADX (14) is reflecting the weak trend with high buying pressure. Therefore, SO is likely to remain range-bound between 35 and 36 levels. This consolidation is very crucial as the stock has already reached its 52-week high. Considering that the stock generally undergoes a correction after hitting a new high, the downward price action of SO would have the support of the 50-day moving average (MA) at 31 levels, followed by the 200-day MA at 30 levels. |
| Thus, short-term traders can book profits till SO undergoes a directional breakout and reenter the trade above $35.50. But long-term traders can partly carry their long positions during the consolidation period with the stop-loss at $34. |
Active trader in the Indian stock markets since 2003 and a full-time writer. Trading is largely based upon technical analysis.
| Company: | Independent |
| Address: | C1/3 Parth Indraprasth Towers. Vastrapur |
| Ahmedabad, Guj 380015 | |
| E-mail address: | chaitalimohile@yahoo.co.in |
Traders' Resource Links | |
| Independent has not added any product or service information to TRADERS' RESOURCE. | |
Click here for more information about our publications!
PRINT THIS ARTICLE

Request Information From Our Sponsors
- StockCharts.com, Inc.
- Candle Patterns
- Candlestick Charting Explained
- Intermarket Technical Analysis
- John Murphy on Chart Analysis
- John Murphy's Chart Pattern Recognition
- John Murphy's Market Message
- MurphyExplainsMarketAnalysis-Intermarket Analysis
- MurphyExplainsMarketAnalysis-Visual Analysis
- StockCharts.com
- Technical Analysis of the Financial Markets
- The Visual Investor
- VectorVest, Inc.
- Executive Premier Workshop
- One-Day Options Course
- OptionsPro
- Retirement Income Workshop
- Sure-Fire Trading Systems (VectorVest, Inc.)
- Trading as a Business Workshop
- VectorVest 7 EOD
- VectorVest 7 RealTime/IntraDay
- VectorVest AutoTester
- VectorVest Educational Services
- VectorVest OnLine
- VectorVest Options Analyzer
- VectorVest ProGraphics v6.0
- VectorVest ProTrader 7
- VectorVest RealTime Derby Tool
- VectorVest Simulator
- VectorVest Variator
- VectorVest Watchdog
