

HOT TOPICS LIST
- MACD
- Fibonacci
- RSI
- Gann
- ADXR
- Stochastics
- Volume
- Triangles
- Futures
- Cycles
- Volatility
- ZIGZAG
- MESA
- Retracement
- Aroon
INDICATORS LIST
LIST OF TOPICS
PRINT THIS ARTICLE
by Billy Williams
Breakout moves can be explosive opportunities for the skilled trader but also can be difficult to determine which moves are real breakouts. Now, two simple indicators can help you filter good breakout trades from bad ones.
Position: N/A
Billy Williams
Billy Williams has been trading the markets for 27 years, specializing in momentum trading with stocks and options.
PRINT THIS ARTICLE
BREAKOUTS
Simple Indicators For Spotting Emerging Trends
07/27/10 08:56:50 AMby Billy Williams
Breakout moves can be explosive opportunities for the skilled trader but also can be difficult to determine which moves are real breakouts. Now, two simple indicators can help you filter good breakout trades from bad ones.
Position: N/A
| When a stock's price is experiencing a period of expansion, it can be an exciting time for traders to capitalize on entering into new trends. Conversely, when a stock or market is experiencing a period of price stagnation where it becomes trapped in a trading range, it can be a frustrating experience for breakout traders or trend-followers. After a big move in a given direction, prices can begin to settle into a trading range or a period of price consolidation when there are not enough buyers or sellers entering the market to take control of the stock. This results in a trendless state in the stock's price action where price trades in the ebb and flow of up and down trading between two price points. It is during this period of lackluster activity that become a test of patience for most traders as you wait for the bulls or bears to take control, forcefully emerging the stock out of this range and into a resumption of the primary trend. |
| Unfortunately, this type of price action can result in a period of false breakouts where price appears to be emerging out its trading range but then quickly reverses. While intitially giving the appearance of a strong price move, these false breakouts draw in traders who are trading off their computer monitors at home, typically resulting in a series of failed moves, as there is not enough buying or selling volume to give sufficient follow-through for the breakout to continue in its direction. This kind of repetitive false start can be very frustrating and lead to stress, not to mention a string of losses. |
| However, there is a simple way to filter out of some of these false price moves by using Bollinger bands and Keltner channels. Bollinger bands are an indicator that tracks the standard deviation of the stock's price movement, resulting in upper, lower, and median averages that form bands over the stock's price action. Keltner channels are an indicator that tracks the high, low, and close of a stock's price action, forming upper, lower, and median moving averages. Place both indicators over a stock's price action on a chart and look for any sign of the stock trading in a range where the Bollinger bands are inside the Keltner channels. The longer the Bollinger bands trade within the Keltner channels, typically, the stronger the price will break out of this range. See Figure 1. |
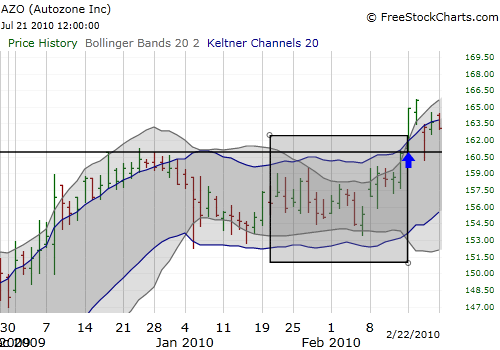
|
| FIGURE 1: BOLLINGER BANDS AND KELTNER CHANNELS. AZO's Bollinger bands begin to trade within its Keltner channels on 1/26/10 before breaking out to the upside on 2/16/10. |
| Graphic provided by: FreeStockCharts.com. |
| |
| Autozone (AZO) had been experiencing trading within a tight range for a couple of months, but eventually, the price range had become so constricted that the Bollinger bands began to trade within the Keltner channels setting up for a strong breakout. On February 16, 2010, AZO made a strong move to the upside of the trading range on strong volume, giving you the opportunity to enter in at $161 just above the resistance line. See Figure 2. |
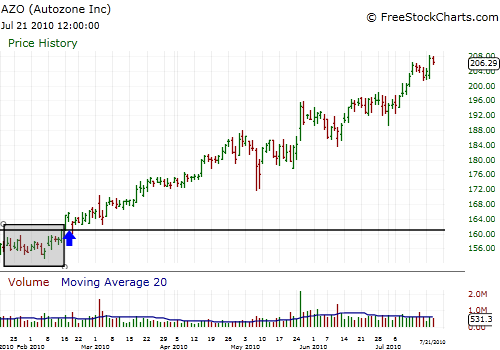
|
| FIGURE 2: AZO. AZO's breakout move produced a strong bull run to the upside, taking it from its breakout price point of $161 to more than $208.20 just five months later. |
| Graphic provided by: FreeStockCharts.com. |
| |
| Price continued to trade higher over the next five months, trading as high as $208.20. This was a potential gain of 47 points, or 29% during this time. Breakouts offer explosive moves, especially after a period of price consolidation where the stock is resuming the prior trend. Using simple indicators can help you spot strong potential candidates, tracking them until the time is right to enter the right stock at the right time. |
Billy Williams has been trading the markets for 27 years, specializing in momentum trading with stocks and options.
| Company: | StockOptionSystem.com |
| E-mail address: | stockoptionsystem.com@gmail.com |
Traders' Resource Links | |
| StockOptionSystem.com has not added any product or service information to TRADERS' RESOURCE. | |
Click here for more information about our publications!
Comments
Date:�07/30/10Rank:�3Comment:�

Request Information From Our Sponsors
- StockCharts.com, Inc.
- Candle Patterns
- Candlestick Charting Explained
- Intermarket Technical Analysis
- John Murphy on Chart Analysis
- John Murphy's Chart Pattern Recognition
- John Murphy's Market Message
- MurphyExplainsMarketAnalysis-Intermarket Analysis
- MurphyExplainsMarketAnalysis-Visual Analysis
- StockCharts.com
- Technical Analysis of the Financial Markets
- The Visual Investor
- VectorVest, Inc.
- Executive Premier Workshop
- One-Day Options Course
- OptionsPro
- Retirement Income Workshop
- Sure-Fire Trading Systems (VectorVest, Inc.)
- Trading as a Business Workshop
- VectorVest 7 EOD
- VectorVest 7 RealTime/IntraDay
- VectorVest AutoTester
- VectorVest Educational Services
- VectorVest OnLine
- VectorVest Options Analyzer
- VectorVest ProGraphics v6.0
- VectorVest ProTrader 7
- VectorVest RealTime Derby Tool
- VectorVest Simulator
- VectorVest Variator
- VectorVest Watchdog