HOT TOPICS LIST
- MACD
- Fibonacci
- RSI
- Gann
- ADXR
- Stochastics
- Volume
- Triangles
- Futures
- Cycles
- Volatility
- ZIGZAG
- MESA
- Retracement
- Aroon
INDICATORS LIST
LIST OF TOPICS
PRINT THIS ARTICLE
by Donald W. Pendergast, Jr.
The CCI 12/10 trading system returned good set of historical performance stats over a 19-year test on a diverse group of large-cap stocks. But how has the system performed in the nine months since the article in which it was introduced was written?
Position: N/A
Donald W. Pendergast, Jr.
Donald W. Pendergast is a financial markets consultant who offers specialized services to stock brokers and high net worth individuals who seek a better bottom line for their portfolios.
PRINT THIS ARTICLE
TRADING SYSTEMS
CCI 12/10 System Still Pulling Strong
07/27/10 08:44:17 AMby Donald W. Pendergast, Jr.
The CCI 12/10 trading system returned good set of historical performance stats over a 19-year test on a diverse group of large-cap stocks. But how has the system performed in the nine months since the article in which it was introduced was written?
Position: N/A
| The CCI 2/10 trading system was the subject of my October 27, 2009, Traders.com Advantage (TCA) article entitled "A Trading System To Build On." How has the system performed since then? Not bad, especially considering the violent downdrafts of the past three months in the broad US markets. |

|
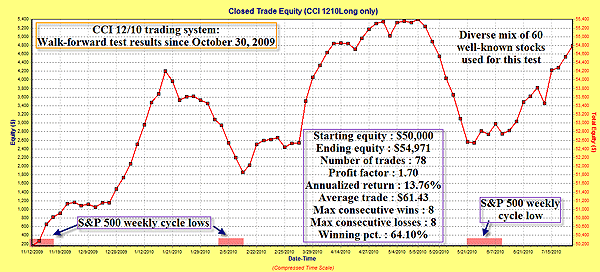
| FIGURE 1: CCI 12/10 TRADING SYSTEM. "No bull." That's precisely the time in the market (when there's no bullish rally period) to go flat with this particular trading system, at least according the serpentine equity curve line depicted here. Note how well the CCI 12/10 system performs coming out of each major weekly low in the S&P 500 (red boxes at bottom of chart). |
| Graphic provided by: Compuvision's TradeSim Enterprise. |
| |
| For a long-only system, one of the key measures of robustness is the ability of such a system to stay above water during confirmed bear market phases. In Figure 1, we see the equity curve for one of the 10,000 Monte Carlo passes for this system using the same 60 stocks featured in my recent TCA piece, "Reversed MACD System Continues To Perform." Once again, here are the stocks used for this CCI 12/10 forward test, spanning the dates from October 30, 2009, through July 16, 2010: AA, AAPL, ADBE, ADP, ADSK, ALTR, AMAT, AMGN, APA, AXP, AZO, BA, BAC, BHP, CA, CAT, CELG, CMCSA, COF, CSCO, CTAS, DD, DELL, DUK, ERTS, EXPD, F, FAST, FISV, FWLT, GENZ, GS, HAL, HL, HD, HANS, HOLX, INTC, JBHT, KLAC, LLTC, LRCX, MCD, MEE, MSFT, NEM, ORCL, PAYX, PCAR, ROST, SCHW.K, SIAL, SPLS, SYMC, TEVA, UPS, WFC, WM, XLNX, XOM All sectors of the stock market are covered by this list without giving any single industry group an unfair advantage due to overconcentration. As you review the equity curve, it's easy to see that the CCI 12/10 long-only system does an admirable job of bringing home the bacon when traded in the direction of broad market strength. If you look at the dates for each low point in the equity curve, you'll see that they closely coincide with every recent weekly cycle low in the Standard & Poor's 500. This includes the November 6, 2009, low, the February 5, 2010, low and the more recent and less visible June 11, 2010, cycle low. The upshot here is that if you can learn to time the weekly cycle lows in the S&P 500 (they usually occur at 15- to 21-week intervals), you'll be miles ahead of the average investor/trader when using a long-only trading method like this. Of course, you'll still need to determine when to stop trading the system before it gives back too much of the gains provided on each bullish thrust in the broad markets. Ah, but who said trading a system was easy! Did you think it was as simple as pushing a button or two and then waiting for the Brink's truck to pull up at your front door with all the profits? By the way, the complete MetaStock code for this system is included in that October 27, 2009, TCA piece, so get a hold of that article if you want to see the nuts and bolts of this simple and effective trading regimen. The system uses an 8% initial stop-loss for all trades; no trailing stop is used. All of the essential system stats for this nine-month forward test are plotted right on the equity curve chart; all in all, it does very well indeed. Here are some other pertinent testing details: * Only long trade entries were taken. * An 8% stop-loss was used. * A maximum of eight stock positions could be held at a given time, with an 12.50% allocation of available account equity granted to each new position. * No more than one new stock position could be added on any given day. * Commissions were set at $0.012 per share traded, with a minimum commission cost of $1.00 per trade. Now let's take a look at the variability of the CCI 12/10 system returns obtained during the 10,000-pass Monte Carlo run of this nine-month forward test (Figure 2): |

|
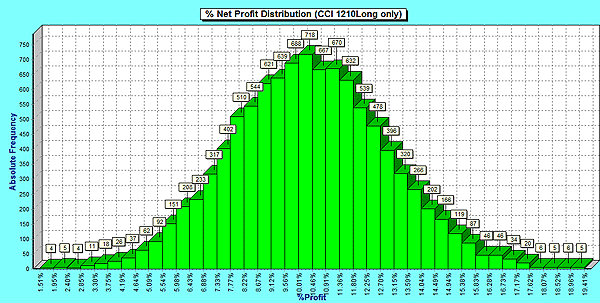
| FIGURE 2: BELL CURVE. Another bell curve, another system with a very good chance of realizing 100% probability of profit in the real world of trading. For a long-only system, the CCI 12/10 strategy is fairly stable and predictable in a variety of market conditions. |
| Graphic provided by: Compuvision's TradeSim Enterprise. |
| |
| Just as in the previous article dealing with the reversed MACD trading system, we'll take a good look at the histogram of the absolute percentage returns of the system since October 30, 2009. Each histogram bar represents a portion of the 10,000 Monte Carlo passes; the height of the bar indicates the number of passes that fall within a certain performance range. The width of the bar covers a 0.45% performance range; taken as a whole, the histogram paints a favorable picture of the performance variability that can likely be obtained when trading this system in the real world. Note how low the number of occurrences are at both extremes of the histogram (the tails); on the left side of the chart we see that even the poorest performing runs still offered returns of better than 1.5% since the start of the test. On the far right side of the chart, a few runs even provided returns exceeding 19% during the past 8.75 months. Using a one standard deviation calculation, we can say that 68% of the time, this system returned between $3,886 to $6,428 in profits during this particular time in history (again, based on a $50,000 starting equity, using all of the position sizing and commission settings previously discussed). Traders wishing to improve this system might wish to alter the stop-loss setting to see if a tighter or looser stop changes the system's equity curve by any significant measure. In addition, the basic entry/exit triggers remain unoptimized (see the October 27, 2009, article for the specific CCI indicator settings). I tested a variety of CCI lengths, and the ones used in the original article continue to perform well. You may be able to fiddle with them and obtain better results, but don't go too crazy on the optimization or you'll end up with a curve-fitted monstrosity that might fall apart the minute you trade it with real money. If you doubt this advice, go ahead and see what happens if you make the mistake of fine-tuning a system down to the nth degree and then try to trade it with big money. It won't be pretty. (Did you know the easiest way to become a multimillionaire? Simple: Just take a billion dollars, trade it without a proven system and wait a day!) |
| The CCI 12/10 trading system is simple, easily implemented in most trading/charting platforms, and tends to give above average returns during bullish phases in the broad markets. What more could you ask for? Take it out for a spin and try it out in your favorite simulator to see if it's a good fit for your unique trading temperament. |
Donald W. Pendergast is a financial markets consultant who offers specialized services to stock brokers and high net worth individuals who seek a better bottom line for their portfolios.
| Title: | Writer, market consultant |
| Company: | Linear Trading Systems LLC |
| Jacksonville, FL 32217 | |
| Phone # for sales: | 904-239-9564 |
| E-mail address: | lineartradingsys@gmail.com |
Traders' Resource Links | |
| Linear Trading Systems LLC has not added any product or service information to TRADERS' RESOURCE. | |
Click here for more information about our publications!
Comments

Request Information From Our Sponsors
- StockCharts.com, Inc.
- Candle Patterns
- Candlestick Charting Explained
- Intermarket Technical Analysis
- John Murphy on Chart Analysis
- John Murphy's Chart Pattern Recognition
- John Murphy's Market Message
- MurphyExplainsMarketAnalysis-Intermarket Analysis
- MurphyExplainsMarketAnalysis-Visual Analysis
- StockCharts.com
- Technical Analysis of the Financial Markets
- The Visual Investor
- VectorVest, Inc.
- Executive Premier Workshop
- One-Day Options Course
- OptionsPro
- Retirement Income Workshop
- Sure-Fire Trading Systems (VectorVest, Inc.)
- Trading as a Business Workshop
- VectorVest 7 EOD
- VectorVest 7 RealTime/IntraDay
- VectorVest AutoTester
- VectorVest Educational Services
- VectorVest OnLine
- VectorVest Options Analyzer
- VectorVest ProGraphics v6.0
- VectorVest ProTrader 7
- VectorVest RealTime Derby Tool
- VectorVest Simulator
- VectorVest Variator
- VectorVest Watchdog
