

HOT TOPICS LIST
- MACD
- Fibonacci
- RSI
- Gann
- ADXR
- Stochastics
- Volume
- Triangles
- Futures
- Cycles
- Volatility
- ZIGZAG
- MESA
- Retracement
- Aroon
INDICATORS LIST
LIST OF TOPICS
PRINT THIS ARTICLE
by Chaitali Mohile
Two head & shoulders patterns on two different time frames.
Position: N/A
Chaitali Mohile
Active trader in the Indian stock markets since 2003 and a full-time writer. Trading is largely based upon technical analysis.
PRINT THIS ARTICLE
HEAD & SHOULDERS
$COMPQ Forms Head & Shoulders
07/21/10 08:09:10 AMby Chaitali Mohile
Two head & shoulders patterns on two different time frames.
Position: N/A
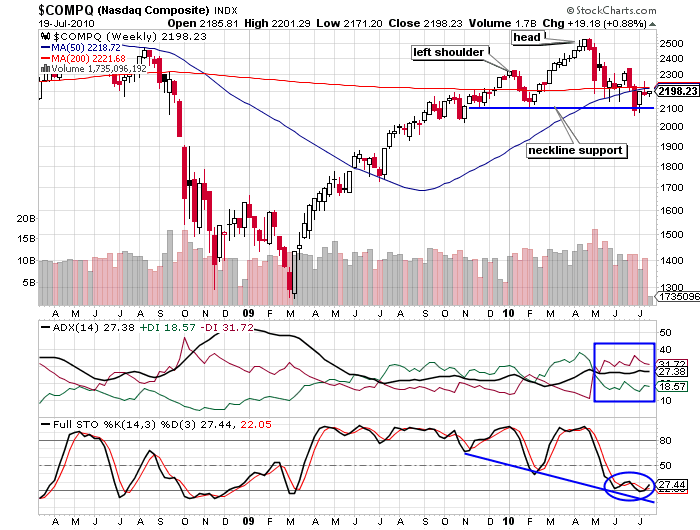
| The NASDAQ Composite has been bouncing off the support of the 200-day moving average (MA). Before surging from the MA support, the index marginally breached the support and formed another support at 2100 levels. You can see in Figure 1 that both these supports were frequently challenged. A head & shoulders top pattern with the neckline support at 2100 levels is clearly visible on the chart in Figure 1. However, the current bearish rally is likely to construct the right shoulder. The full stochastic (14,3,3) has formed the same pattern with a declining neckline support. The average directional index (ADX) (14) is indicating a developing downtrend. Since May, the downtrend continued with stable speed, gradually increasing the selling pressure on $COMPQ. |
|
| |
| Thus, the indicators confirmed the head & shoulder top reversal formation in Figure 1. Once, the right shoulder formation is complete and the neckline support is retested, $COMPQ could be ready to break downwards. The bearish breakout could lead the index to the estimated levels of 1700 measured by subtracting the length of the highest peak (head) from the neckline support; 2500-2100= 400-2100=1700. However, the index has to undergo a confirmed breakout and has to sustain below the newly formed neckline resistance. Although the stochastic oscillator has formed a descending neckline, the oscillator has hit an oversold region at 20, signifying the possibility of a bullish rally in the next few weeks. In addition, the weekly time frame chart gives a medium-term outlook for about two to three months, so traders need not jump into short-positions in anticipation of the bearish breakout. |
| Due to the oversold stochastic, $COMPQ may remain range-bound between the 200-day MA resistance and the neckline support. The convergence of the 50-day MA with the 200-day MA has made the resistance at 2200 stronger. |
|
| |
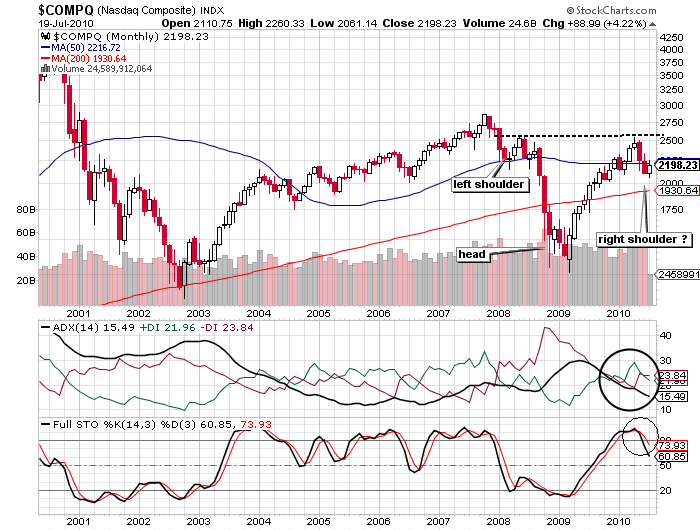
| Now let us turn to a longer term technical chart of $COMPQ. The monthly time frame in Figure 2 shows another head & shoulders formation but an inverted formation that breaks upwards. In this chart also, the right shoulder is yet to be formed. To construct the right shoulder, $COMPQ would retrace to the 200-day MA support at 1930 levels. Therefore, the index is likely to undergo the bearish breakout of the head & shoulders top reversal formation (Figure 1). A downward move of the overbought stochastic (14,3,3) will confirm the formation of the right shoulder of an inverted pattern in Figure 2. The formation has a neckline resistance at 2500 levels. A bullish breakout of the pattern would drag the index to new highs which can be measured by calculating the distance between the head and the neckline and adding it to the breakout level (neckline). |
| Thus, $COMPQ is forming two different head & shoulders patterns, breaking in two opposite directions. Since both the charts display the long-term results, traders are requested to act accordingly with great patience. |
Active trader in the Indian stock markets since 2003 and a full-time writer. Trading is largely based upon technical analysis.
| Company: | Independent |
| Address: | C1/3 Parth Indraprasth Towers. Vastrapur |
| Ahmedabad, Guj 380015 | |
| E-mail address: | chaitalimohile@yahoo.co.in |
Traders' Resource Links | |
| Independent has not added any product or service information to TRADERS' RESOURCE. | |
Click here for more information about our publications!
PRINT THIS ARTICLE

Request Information From Our Sponsors
- StockCharts.com, Inc.
- Candle Patterns
- Candlestick Charting Explained
- Intermarket Technical Analysis
- John Murphy on Chart Analysis
- John Murphy's Chart Pattern Recognition
- John Murphy's Market Message
- MurphyExplainsMarketAnalysis-Intermarket Analysis
- MurphyExplainsMarketAnalysis-Visual Analysis
- StockCharts.com
- Technical Analysis of the Financial Markets
- The Visual Investor
- VectorVest, Inc.
- Executive Premier Workshop
- One-Day Options Course
- OptionsPro
- Retirement Income Workshop
- Sure-Fire Trading Systems (VectorVest, Inc.)
- Trading as a Business Workshop
- VectorVest 7 EOD
- VectorVest 7 RealTime/IntraDay
- VectorVest AutoTester
- VectorVest Educational Services
- VectorVest OnLine
- VectorVest Options Analyzer
- VectorVest ProGraphics v6.0
- VectorVest ProTrader 7
- VectorVest RealTime Derby Tool
- VectorVest Simulator
- VectorVest Variator
- VectorVest Watchdog