HOT TOPICS LIST
- MACD
- Fibonacci
- RSI
- Gann
- ADXR
- Stochastics
- Volume
- Triangles
- Futures
- Cycles
- Volatility
- ZIGZAG
- MESA
- Retracement
- Aroon
INDICATORS LIST
LIST OF TOPICS
PRINT THIS ARTICLE
by Koos van der Merwe
Steve Jobs is facing criticism over the iPhone reception because of a badly placed antenna. Will I give up my iPhone and iPad because of it? Not a chance.
Position: Buy
Koos van der Merwe
Has been a technical analyst since 1969, and has worked as a futures and options trader with First Financial Futures in Johannesburg, South Africa.
PRINT THIS ARTICLE
ELLIOTT WAVE
Apple, Steve Jobs, And My Two Bits
07/19/10 12:53:16 PMby Koos van der Merwe
Steve Jobs is facing criticism over the iPhone reception because of a badly placed antenna. Will I give up my iPhone and iPad because of it? Not a chance.
Position: Buy
| I have always found that a king often finds that he is wearing no clothes. Steve Jobs is the current king, and many out there are looking to dress him in clothes that no one can see — in other words, put him in a position where a little girl will shout out, "But he is naked," and thus embarrass him. In his case, however, there is no doubt this strategy will backfire, because all that the slander and criticism will do is make him more efficient and more cautious in what he offers the market in the future. What does he have that no one else does? Simple: Imagination. Mentally, he is still a boy, and he knows that the difference between men and boys is the price of their toys. He knows that deep down, everyone, no matter what age or sex, likes a good toy, and there are no better adult toys on the market at the moment than the iPhone and the iPad. To make it even more attractive, the iPad is being introduced to more countries this week, and the demand should increase Apples sales and of course profits. What do charts say? |

|
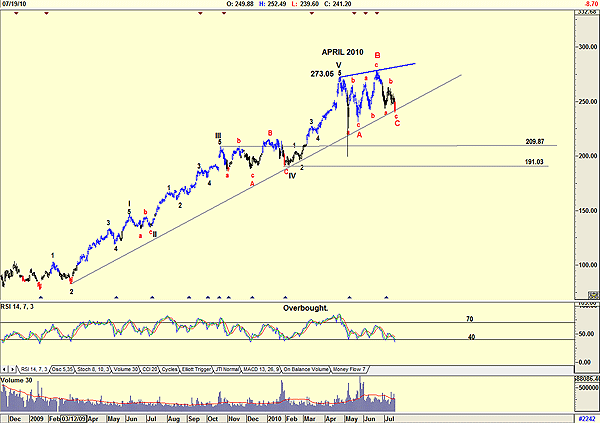
| FIGURE 1: APPLE, DAILY. Here's the first count. |
| Graphic provided by: AdvancedGET. |
| |
| Figure 1 is a daily chart and is confusing. It does suggest that the stock price topped out in Wave V during April 2010, with the relative strength index (RSI) at overbought Levels. From that date the share dropped in a Wave A down, but Wave B was higher than Wave V, which means that Wave C will be flat. That is, of course, if my wave count is correct. Then again, the wave count could be that of Figure 2. |

|
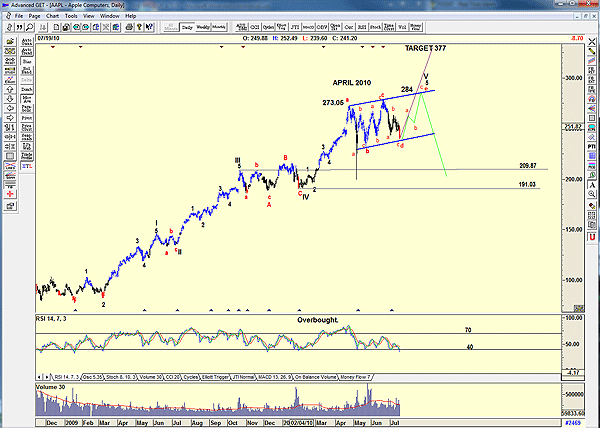
| FIGURE 2: APPLE, DAILY. Here's Apple with an alternative count. |
| Graphic provided by: AdvancedGET. |
| |
| In Figure 2 I am showing the count as a rising flag, which suggests two results, simply because in all my patterns I have never heard of a rising flag. The pattern can either follow that of a rising pennant, which means that at "e" as shown the price can top out as Wave V and then fall to test the $191 to $209 range, or it can follow that typical flag pattern, which suggests a target of $377 (273 - 191 = 93 + 284 = 377). Remarkably enough, this is close to the target, given by most of the fundamentalists out there. Therefore, the decision is yours. Do you trust the ingenuity of Steve Jobs, or do you listen to all the Apple bears out there, or can you read something in the charts that I have missed? Me? I love my iPhone and even more, my iPad, and knowing Steve Jobs, the present drama will only make him a better man. |
Has been a technical analyst since 1969, and has worked as a futures and options trader with First Financial Futures in Johannesburg, South Africa.
| Address: | 3256 West 24th Ave |
| Vancouver, BC | |
| Phone # for sales: | 6042634214 |
| E-mail address: | petroosp@gmail.com |
Click here for more information about our publications!
PRINT THIS ARTICLE

Request Information From Our Sponsors
- StockCharts.com, Inc.
- Candle Patterns
- Candlestick Charting Explained
- Intermarket Technical Analysis
- John Murphy on Chart Analysis
- John Murphy's Chart Pattern Recognition
- John Murphy's Market Message
- MurphyExplainsMarketAnalysis-Intermarket Analysis
- MurphyExplainsMarketAnalysis-Visual Analysis
- StockCharts.com
- Technical Analysis of the Financial Markets
- The Visual Investor
- VectorVest, Inc.
- Executive Premier Workshop
- One-Day Options Course
- OptionsPro
- Retirement Income Workshop
- Sure-Fire Trading Systems (VectorVest, Inc.)
- Trading as a Business Workshop
- VectorVest 7 EOD
- VectorVest 7 RealTime/IntraDay
- VectorVest AutoTester
- VectorVest Educational Services
- VectorVest OnLine
- VectorVest Options Analyzer
- VectorVest ProGraphics v6.0
- VectorVest ProTrader 7
- VectorVest RealTime Derby Tool
- VectorVest Simulator
- VectorVest Variator
- VectorVest Watchdog
