HOT TOPICS LIST
- MACD
- Fibonacci
- RSI
- Gann
- ADXR
- Stochastics
- Volume
- Triangles
- Futures
- Cycles
- Volatility
- ZIGZAG
- MESA
- Retracement
- Aroon
INDICATORS LIST
LIST OF TOPICS
PRINT THIS ARTICLE
by David Penn
The rally in the fourth quarter of 2001 may be luring bulls into a 2002 trap.
Position: N/A
David Penn
Technical Writer for Technical Analysis of STOCKS & COMMODITIES magazine, Working-Money.com, and Traders.com Advantage.
PRINT THIS ARTICLE
BULL/BEAR MARKET
The Dow: Breakout or Bull Trap?
01/10/02 11:15:57 AMby David Penn
The rally in the fourth quarter of 2001 may be luring bulls into a 2002 trap.
Position: N/A
| I come to praise the fourth quarter rally of 2001, not to bury it. After all, the fourth quarter rally in the Dow Industrials has brought prescient investors and traders a three-month return of more than 25%. Whether you bought in response to a technical signal or were swayed by patriotic exhortations (in the States, at least) to buy stocks for the war effort, the happy fact of the matter is that investors who had been battered all year were given at least some reason for cheer before the year was through. |
| However, as the saying goes, a man must know his limitations. And so should traders and investors who may have enjoyed the most bullish period in the market since the rally from the March lows of 2001 consider the fact that the fourth quarter rally of 2001 was indeed a bear market rally, and not the start of a new primary bull move. |

|
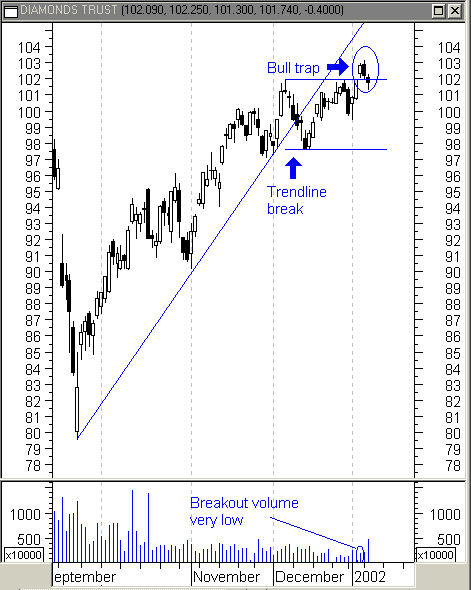
| A new higher low at 99.5 will help determine if the Dow advance will stay on higher ground. |
| Graphic provided by: MetaStock. |
| |
| The Dow rally (as represented by the Diamonds or DIA) peaked in early December at 101.95. At this point, the Dow had gained 28% since September 21st. The correction from the early December peak took the DIAs down to the previous correction low of about 97 from the end of November. This set up the initial test of the top. Had the correction continued down below the 97 support level, then there would have been a strong likelihood of a reversal in trend. |
| But prices rallied in December, successfully rebounding from support at 97, and headed back toward the test of the top around 102. The moment of truth arrived on January 4th when prices gapped up to close at 102.82, setting a new 30-day high. For those trying to decide whether or not the rally was over, this would have been a strong signal that the uptrend has resumed. |
| Unfortunately, it currently looks as if that breakout may have been a false one, as the DIAs have begun to sink back into the trading range based on the previous high at 101.95 and the most recent correction low of 97. While this "bull trap" does not necessarily mean that the Dow is in fact reversing its trend, it does suggest that the 102 level still represents significant resistance, and any low volume advances beyond 102 are likely to be suspect. A close look at the volume on the breakout/bull trap day of January 4th reveals particularly low levels of buying. The increased volume on the pullback day of January 8th further heightens suspicions that, though the DIAs may be headed higher, they are not ready for a sustained breakout yet. |
Technical Writer for Technical Analysis of STOCKS & COMMODITIES magazine, Working-Money.com, and Traders.com Advantage.
| Title: | Technical Writer |
| Company: | Technical Analysis, Inc. |
| Address: | 4757 California Avenue SW |
| Seattle, WA 98116 | |
| Phone # for sales: | 206 938 0570 |
| Fax: | 206 938 1307 |
| Website: | www.Traders.com |
| E-mail address: | DPenn@traders.com |
Traders' Resource Links | |
| Charting the Stock Market: The Wyckoff Method -- Books | |
| Working-Money.com -- Online Trading Services | |
| Traders.com Advantage -- Online Trading Services | |
| Technical Analysis of Stocks & Commodities -- Publications and Newsletters | |
| Working Money, at Working-Money.com -- Publications and Newsletters | |
| Traders.com Advantage -- Publications and Newsletters | |
| Professional Traders Starter Kit -- Software | |
Click here for more information about our publications!
Comments
Date: 01/13/02Rank: 5Comment:
Date: 01/15/02Rank: 5Comment:
Date: 01/16/02Rank: 5Comment:

Request Information From Our Sponsors
- StockCharts.com, Inc.
- Candle Patterns
- Candlestick Charting Explained
- Intermarket Technical Analysis
- John Murphy on Chart Analysis
- John Murphy's Chart Pattern Recognition
- John Murphy's Market Message
- MurphyExplainsMarketAnalysis-Intermarket Analysis
- MurphyExplainsMarketAnalysis-Visual Analysis
- StockCharts.com
- Technical Analysis of the Financial Markets
- The Visual Investor
- VectorVest, Inc.
- Executive Premier Workshop
- One-Day Options Course
- OptionsPro
- Retirement Income Workshop
- Sure-Fire Trading Systems (VectorVest, Inc.)
- Trading as a Business Workshop
- VectorVest 7 EOD
- VectorVest 7 RealTime/IntraDay
- VectorVest AutoTester
- VectorVest Educational Services
- VectorVest OnLine
- VectorVest Options Analyzer
- VectorVest ProGraphics v6.0
- VectorVest ProTrader 7
- VectorVest RealTime Derby Tool
- VectorVest Simulator
- VectorVest Variator
- VectorVest Watchdog
