HOT TOPICS LIST
- MACD
- Fibonacci
- RSI
- Gann
- ADXR
- Stochastics
- Volume
- Triangles
- Futures
- Cycles
- Volatility
- ZIGZAG
- MESA
- Retracement
- Aroon
INDICATORS LIST
LIST OF TOPICS
PRINT THIS ARTICLE
by Donald W. Pendergast, Jr.
The reversed MACD trading system, originally described in the March 2009 STOCKS & COMMODITIES, continues to perform well.
Position: N/A
Donald W. Pendergast, Jr.
Donald W. Pendergast is a financial markets consultant who offers specialized services to stock brokers and high net worth individuals who seek a better bottom line for their portfolios.
PRINT THIS ARTICLE
TRADING SYSTEMS
Reversed MACD System Continues To Perform
07/19/10 08:46:32 AMby Donald W. Pendergast, Jr.
The reversed MACD trading system, originally described in the March 2009 STOCKS & COMMODITIES, continues to perform well.
Position: N/A
| A 19-year backtest is one thing, but how has the reversed moving average convergence/divergence (MACD) trading system performed since it was first described in the pages of the March 2009 issue of STOCKS & COMMODITIES? Actually, it's done very well, offering returns better than 17% annualized since the beginning of March 2009. Here's a closer look at some of the key stats and testing procedures used on this go-round. |

|
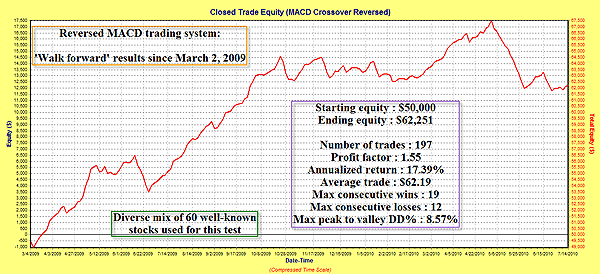
| FIGURE 1: REVERSED MACD SYSTEM. The reversed MACD trading system appears to perform best during persistently bullish phases in the broad market. As a long-only system, however, it has held up reasonably well during sideways and bearish periods in the market. Can you think of ways to use broad market timing to help improve the system's performance? |
| Graphic provided by: Compuvision's TradeSim Enterprise. |
| |
| To run the walk-forward test (Figure 1), I used a diverse batch of 60 well-known stocks, equities that have been traded since at least January 2001. Every major sector is represented to avoid skewing of the test results. Here are the stocks used: AA, AAPL, ADBE, ADP, ADSK, ALTR, AMAT, AMGN, APA, AXP, AZO, BA, BAC, BHP, CA, CAT, CELG, CMCSA, COF, CSCO, CTAS, DD, DELL, DUK, ERTS, EXPD, F, FAST, FISV, FWLT, GENZ, GS, HAL, HL, HD, HANS, HOLX, INTC, JBHT, KLAC, LLTC, LRCX, MCD, MEE, MSFT, NEM, ORCL, PAYX, PCAR, ROST, SCHW.K, SIAL, SPLS, SYMC, TEVA, UPS, WFC, WM, XLNX, XOM Plotted in Figure 2 is the equity curve for one of the test runs; this particular run has a performance that is slightly below the average obtained during a 10,000-run Monte Carlo sweep, one intended to determine just how well the system has performed since spring 2009. Judging from the slope of the equity curve, the system outperformed during the strong bull rally phase that ran from early March 2009 through September 2009; after that, it chopped along sideways for the rest of 2009 before surging to a new equity high of more than $67,500 by late April 2010. The system gave up a lot of gains during the May and June market swoon, but it is still up by more than 17% annualized since the test began. For such a simple system concept (reversing the standard MACD crossover trading system entry and exit triggers; see the issue for full details), it appears to be holding up exceptionally well, considering the severity of the broad market declines over the past three months. All of the major stats for this particular run are posted on the equity curve chart. Here are some other pertinent testing details: * Only long trade entries were taken. * A 10% stop-loss was added to the original MetaStock code to help limit excessive drawdown. * A maximum of nine stock positions could be held at a given time, with an 11.11% allocation of available account equity granted to each new position. * No more than one new stock position could be added on any given day. * Commissions were set at $0.012 per share traded, with a minimum commission cost of $1.00 per trade. Now let's take a look at the variability of the system returns obtained during the 10,000-pass Monte Carlo run of this forward test. |

|
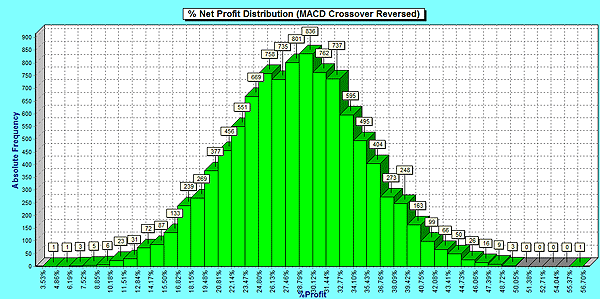
| FIGURE 2: 10,000-PASS MONTE CARLO BELL CURVE. A classic bell curve characterizes the distribution of the 10,000 Monte Carlo passes used to create this histogram of system percentage gains over the past 16 months. Note that the system has a 100% probability of profit over this particular dataset, one that includes nearly 200 trades. |
| Graphic provided by: Compuvision's TradeSim Enterprise. |
| |
| Here, we'll simply look at a histogram of the absolute percentage returns of the system since March 2, 2009. Each histogram bar represents a portion of the 10,000 Monte Carlo passes; the height of the bar indicates the number of passes that fall within a certain performance range. The width of the bar covers a 1.33% performance range; taken as a whole, the histogram paints a very favorable picture of the performance variability that can likely be obtained when trading this system in the real world. Note how low the number of occurrences are at both extremes of the histogram (the tails); on the left side of the chart, we see that even the poorest-performing runs still offered returns of better than 3% since the start of the test. Amazingly, on the far right side of the chart, a few runs even provided returns exceeding 53% during the past 16 months. Using a one standard deviation calculation, we can say that 68% of the time, this system returned between $10,940 to $17,407 in profits during this particular time in history (again, based on a $50,000 starting equity, using all of the position sizing and commission settings previously discussed). Will it do so again over the next 16-month forward test? Who knows, but the fact that the test period used included a strong bullish phase, several choppy phases, and a vicious bear phase, the odds are reasonably good that this long-only stock trading system will continue to perform. Traders wishing to improve this system might want to alter the stop-loss setting to see if a tighter or looser stop changes the system's equity curve by a meaningful amount. In addition, the basic entry/exit triggers remain unoptimized, still set at 12-26-9 (remember, they're reversed!), so that could also be another avenue for system tinkerers to pursue. |
| So, should you be trading the reversed MACD trading system? It has proven profitable in more than 20 years of back- and forward testing, so you may want to dig a little deeper and do some testing and fine tuning of your own to see if it actually suits your trading temperament. |
Donald W. Pendergast is a financial markets consultant who offers specialized services to stock brokers and high net worth individuals who seek a better bottom line for their portfolios.
| Title: | Writer, market consultant |
| Company: | Linear Trading Systems LLC |
| Jacksonville, FL 32217 | |
| Phone # for sales: | 904-239-9564 |
| E-mail address: | lineartradingsys@gmail.com |
Traders' Resource Links | |
| Linear Trading Systems LLC has not added any product or service information to TRADERS' RESOURCE. | |
Click here for more information about our publications!
Comments

Request Information From Our Sponsors
- VectorVest, Inc.
- Executive Premier Workshop
- One-Day Options Course
- OptionsPro
- Retirement Income Workshop
- Sure-Fire Trading Systems (VectorVest, Inc.)
- Trading as a Business Workshop
- VectorVest 7 EOD
- VectorVest 7 RealTime/IntraDay
- VectorVest AutoTester
- VectorVest Educational Services
- VectorVest OnLine
- VectorVest Options Analyzer
- VectorVest ProGraphics v6.0
- VectorVest ProTrader 7
- VectorVest RealTime Derby Tool
- VectorVest Simulator
- VectorVest Variator
- VectorVest Watchdog
- StockCharts.com, Inc.
- Candle Patterns
- Candlestick Charting Explained
- Intermarket Technical Analysis
- John Murphy on Chart Analysis
- John Murphy's Chart Pattern Recognition
- John Murphy's Market Message
- MurphyExplainsMarketAnalysis-Intermarket Analysis
- MurphyExplainsMarketAnalysis-Visual Analysis
- StockCharts.com
- Technical Analysis of the Financial Markets
- The Visual Investor
