HOT TOPICS LIST
- MACD
- Fibonacci
- RSI
- Gann
- ADXR
- Stochastics
- Volume
- Triangles
- Futures
- Cycles
- Volatility
- ZIGZAG
- MESA
- Retracement
- Aroon
INDICATORS LIST
LIST OF TOPICS
PRINT THIS ARTICLE
by Chaitali Mohile
The bearish breakout of BHI has reversed the direction of the rally. Can the stock surge?
Position: Buy
Chaitali Mohile
Active trader in the Indian stock markets since 2003 and a full-time writer. Trading is largely based upon technical analysis.
PRINT THIS ARTICLE
WEDGE FORMATIONS
BHI Regaining Strength?
07/16/10 01:53:56 PMby Chaitali Mohile
The bearish breakout of BHI has reversed the direction of the rally. Can the stock surge?
Position: Buy
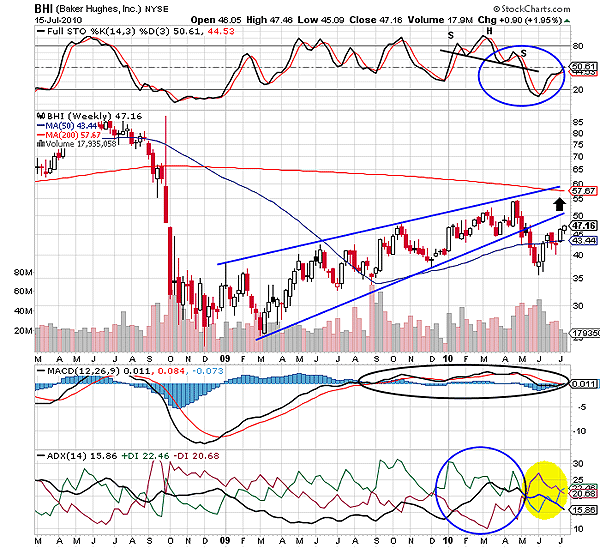
| Since 2009, Baker-Hughes (BHI) has been moving in a converging upward channel. The narrowing range and volatile volume formed a rising wedge pattern on the weekly time frame in Figure 1. Due to the bearish breakout, the formation is considered a bearish reversal that plunges a security or index to much lower levels. However, if the pattern turns older (more than a year), then it is likely to lose strength and result in a breakout failure. The wedge has narrowed, but the two trendlines have not united yet, signifying the continuity of the pattern. The stock has moved within the channel for almost a year and half, and therefore, the bearish breakout in May could not plunge lower. BHI breached the lower trendline as well as the 50-day moving average (MA) support. |
| A head & shoulders pattern with a declining neckline formed by the full stochastic (14,3,3) corresponding with the sudden breakdown of BHI in May. During the bearish breakout, the average directional movement index (ADX) (14) indicated a developing uptrend. But the breakout increased the selling pressure and the ADX line descended below 20 levels, suggesting a weak trend. The moving average convergence/divergence (MACD) (12,26,9) was highly volatile in positive territory but did not plunge below the zero line in negative territory. As you can see, the indicators are giving mixed notes. The bearish breakout converted the newly formed resistance to support and resumed the previous bullish rally. |

|
| FIGURE 1: BHI, WEEKLY |
| Graphic provided by: StockCharts.com. |
| |
| Eventually, BHI established the 50-day support and is ready to breach the lower trendline resistance. Once the stock moves into the channel, traders can trigger a low-risk long trade. Since the ADX (14) has weakened and the MACD (12,26,9) is negative in positive territory, BHI is likely to face tremendous volatility during this new upward journey. |

|
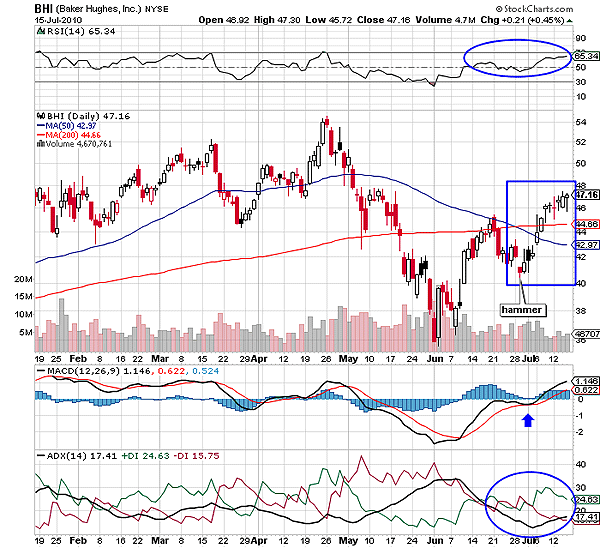
| FIGURE 2: BHI, DAILY |
| Graphic provided by: StockCharts.com. |
| |
| On the daily time frame in Figure 2, BHI has breached the 200-day MA resistance. A small red hammer at the bottom of the blue box initiated the pullback rally for the stock. The small real body, the upper and lower shadows of the candles, signifies the bull's hesitation to climb upward. However, the stock has successfully sustained at the newly formed MA support. After plunging to 10 levels, the ADX (14) has surged above 15 levels with an increased buying pressure, reflecting upcoming demand for BHI. The MACD (12,26,9) has bounced in positive territory, and the relative strength index (RSI)(14) is healthily overbought. Therefore, the indicators are affirmative for the current bullish price action. The developing uptrend would further strengthen the rally of BHI. |
| Thus, BHI is in a bullish mood to regain its previous losses. |
Active trader in the Indian stock markets since 2003 and a full-time writer. Trading is largely based upon technical analysis.
| Company: | Independent |
| Address: | C1/3 Parth Indraprasth Towers. Vastrapur |
| Ahmedabad, Guj 380015 | |
| E-mail address: | chaitalimohile@yahoo.co.in |
Traders' Resource Links | |
| Independent has not added any product or service information to TRADERS' RESOURCE. | |
Click here for more information about our publications!
PRINT THIS ARTICLE

Request Information From Our Sponsors
- VectorVest, Inc.
- Executive Premier Workshop
- One-Day Options Course
- OptionsPro
- Retirement Income Workshop
- Sure-Fire Trading Systems (VectorVest, Inc.)
- Trading as a Business Workshop
- VectorVest 7 EOD
- VectorVest 7 RealTime/IntraDay
- VectorVest AutoTester
- VectorVest Educational Services
- VectorVest OnLine
- VectorVest Options Analyzer
- VectorVest ProGraphics v6.0
- VectorVest ProTrader 7
- VectorVest RealTime Derby Tool
- VectorVest Simulator
- VectorVest Variator
- VectorVest Watchdog
- StockCharts.com, Inc.
- Candle Patterns
- Candlestick Charting Explained
- Intermarket Technical Analysis
- John Murphy on Chart Analysis
- John Murphy's Chart Pattern Recognition
- John Murphy's Market Message
- MurphyExplainsMarketAnalysis-Intermarket Analysis
- MurphyExplainsMarketAnalysis-Visual Analysis
- StockCharts.com
- Technical Analysis of the Financial Markets
- The Visual Investor
