HOT TOPICS LIST
- MACD
- Fibonacci
- RSI
- Gann
- ADXR
- Stochastics
- Volume
- Triangles
- Futures
- Cycles
- Volatility
- ZIGZAG
- MESA
- Retracement
- Aroon
INDICATORS LIST
LIST OF TOPICS
PRINT THIS ARTICLE
by Koos van der Merwe
A descending right-angle triangle will exhibit a horizontal lower boundary and a downsloping upper boundary. But what's that mean?
Position: Sell
Koos van der Merwe
Has been a technical analyst since 1969, and has worked as a futures and options trader with First Financial Futures in Johannesburg, South Africa.
PRINT THIS ARTICLE
TRIANGLES
A Triangle Descends
07/13/10 09:22:28 AMby Koos van der Merwe
A descending right-angle triangle will exhibit a horizontal lower boundary and a downsloping upper boundary. But what's that mean?
Position: Sell
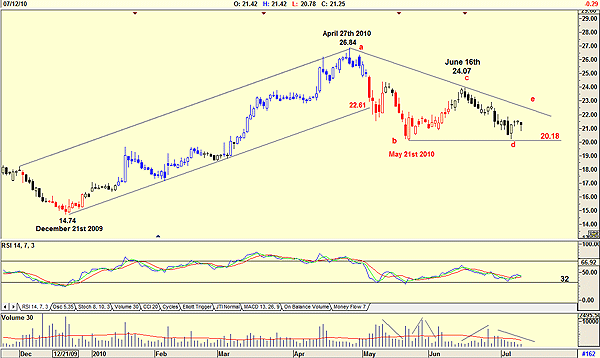
| It means this. A descending triangle occurs when there is a certain amount of demand at a fixed price, and supply comes into the market to meet that demand, but eventually the demand dries up, and the price breaks out of the triangle to the downside. A good example of this formation can be seen in the chart of Constant Contact (CTCT). |

|
| FIGURE 1: CTCT, DAILY. Here's a descending triangle. |
| Graphic provided by: AdvancedGET. |
| |
| Figure 1 is a daily chart of CTCT and shows how the price rose to $28.64 on April 27, 2010, from a low of $14.74 on December 21, 2009. From this level the price dropped on falling volume, a sign of strength, breaking the support line at $22.61 to bottom at $20.14 on May 21, 2010. Volume did rise as the price rebounded from the support line of the triangle b-d but then fell again as the price rose to $24.07 on June 16, at point c, the downsloping upper boundary of the triangle. The price then dropped to $20.18 on rising volume, forming the horizontal lower boundary of the triangle. Since then, the price has been moving sideways on low volume, suggesting a test at $20.18 rather than rising to test the downsloping upper boundary at point e. Note that the 14-period relative strength index (RSI) is not oversold (that is, below the 32 level), also suggesting further weakness. How low can the price go? Triangles are not as reliable as the head & shoulders formation for determining targets. We should therefore look to the various major pivot points for support levels, especially when the RSI is oversold and gives a buy signal. |
| I would definitely not be a buyer of CTCT at present levels. |
Has been a technical analyst since 1969, and has worked as a futures and options trader with First Financial Futures in Johannesburg, South Africa.
| Address: | 3256 West 24th Ave |
| Vancouver, BC | |
| Phone # for sales: | 6042634214 |
| E-mail address: | petroosp@gmail.com |
Click here for more information about our publications!
PRINT THIS ARTICLE

Request Information From Our Sponsors
- StockCharts.com, Inc.
- Candle Patterns
- Candlestick Charting Explained
- Intermarket Technical Analysis
- John Murphy on Chart Analysis
- John Murphy's Chart Pattern Recognition
- John Murphy's Market Message
- MurphyExplainsMarketAnalysis-Intermarket Analysis
- MurphyExplainsMarketAnalysis-Visual Analysis
- StockCharts.com
- Technical Analysis of the Financial Markets
- The Visual Investor
- VectorVest, Inc.
- Executive Premier Workshop
- One-Day Options Course
- OptionsPro
- Retirement Income Workshop
- Sure-Fire Trading Systems (VectorVest, Inc.)
- Trading as a Business Workshop
- VectorVest 7 EOD
- VectorVest 7 RealTime/IntraDay
- VectorVest AutoTester
- VectorVest Educational Services
- VectorVest OnLine
- VectorVest Options Analyzer
- VectorVest ProGraphics v6.0
- VectorVest ProTrader 7
- VectorVest RealTime Derby Tool
- VectorVest Simulator
- VectorVest Variator
- VectorVest Watchdog
