HOT TOPICS LIST
- MACD
- Fibonacci
- RSI
- Gann
- ADXR
- Stochastics
- Volume
- Triangles
- Futures
- Cycles
- Volatility
- ZIGZAG
- MESA
- Retracement
- Aroon
INDICATORS LIST
LIST OF TOPICS
PRINT THIS ARTICLE
by Alan R. Northam
To arrive at a correct analysis of volume momentum, the analyst must use the correct momentum indicator.
Position: N/A
Alan R. Northam
Alan Northam lives in the Dallas, Texas area and as an electronic engineer gave him an analytical mind from which he has developed a thorough knowledge of stock market technical analysis. His abilities to analyze the future direction of the stock market has allowed him to successfully trade of his own portfolio over the last 30 years. Mr. Northam is now retired and trading the stock market full time. You can reach him at inquiry@tradersclassroom.com or by visiting his website at http://www.tradersclassroom.com. You can also follow him on Twitter @TradersClassrm.
PRINT THIS ARTICLE
MOMENTUM
Which Momentum Indicator Should You Use?
07/13/10 12:17:35 PMby Alan R. Northam
To arrive at a correct analysis of volume momentum, the analyst must use the correct momentum indicator.
Position: N/A
| There are many different indicators available to measure momentum. Among these are the momentum indicator and the rate of change (ROC) indicator. These two indicators measure the same thing, with the only difference being the units where the momentum indicator measures a ratio expressed in percent and the ROC indicator measures the difference expressed in shares. These two indicators do not always give similar results, and the technical analyst needs to be aware of these differences so as not to incorrectly analyze the momentum of volume. |
| Normally, the momentum indicator and the ROC indicator are used to measure the momentum of price. However, at times the analyst may need to measure the momentum of volume, as volume is often a leading indicator of price. One method of measuring the momentum of volume is to first plot the on-balance volume (OBV) indicator. This results in a volume plot that trends upward and downward, and ranges sideways similar to the price chart. From the OBV it then becomes a simple matter to measure the momentum of volume by utilizing the momentum or ROC indicator, depending on if the analyst wants the volume momentum results in percent or points. However, the analyst needs to be aware that these two momentum indicators may not give the correct result. The problem lies in the fact that OBV is sometimes expressed in negative numbers and sometimes in positive. When using the standard momentum and ROC indicators, the way the math is performed with positive or negative numbers can result in volume momentum being expressed as weakening when using the momentum indicator and strengthening when using the ROC indicator, when in reality the momentum of volume is strengthening. When OBV is plotted in negative numbers, the momentum indicator will give a false analysis, indicating that volume is weakening, while the ROC indicator will provide a true analysis, indicating that volume is strengthening. However, when OBV is plotted with positive numbers, both the momentum indicator and the ROC indicator will provide a true analysis. Allow me to illustrate these differences with the following two examples: |
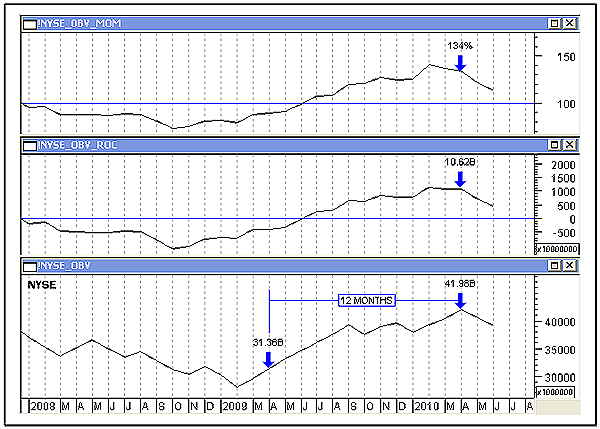
| Figure 1 shows the OBV, in the lower pane, as it is derived from the New York Stock Exchange (NYSE) total volume data. Note that OBV is plotted with positive numbers and has been trending upward since the beginning of 2009. Note also the two plots above the OBV. The middle plot is the ROC indicator derived from the OBV and measures the volume momentum of the uptrending OBV in shares. Note that from April 2009 to April 2010, OBV rose by 10.62 billion shares. In addition, note the momentum indicator in the top panel. Over the same period, OBV rose 134%. In both cases, the volume momentum increased along with OBV, indicating that volume strengthened during this period. |

|
| FIGURE 1: NYSE TOTAL VOLUME, MONTHLY. This chart shows the OBV of the NYSE total volume in the lower pane, and the momentum and rate of change indicators of OBV in the upper panes. |
| Graphic provided by: MetaStock. |
| |
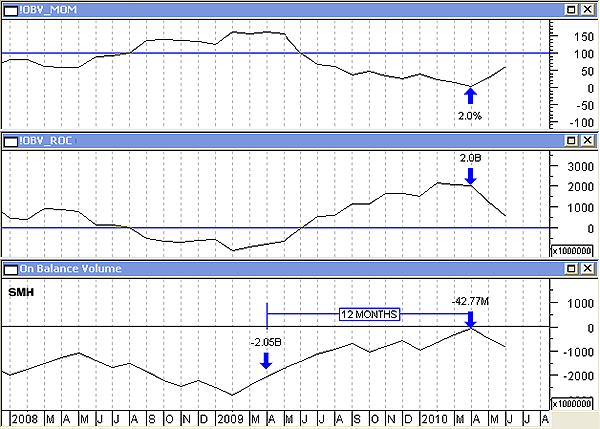
| Next, I draw your attention to Figure 2. Figure 2 shows the OBV, in the lower pane, of the Semiconductors Holders ETF (SMH). The OBV is plotted with negative numbers but has also been trending upward since the beginning of 2009. Note also the two plots above the OBV. The middle plot is the ROC indicator derived from the OBV indicator of SMH and measures volume momentum, in shares, of the uptrending OBV. From April 2009 to April 2010, the OBV rose by 2.0 billion shares. In addition, note the momentum indicator in the top panel. Over the same time period, the momentum indicator reported that the OBV decreased from 150% to 2% for a 148% decrease in volume. While the ROC indicator shows volume of SMH strengthening, the momentum indicator shows volume momentum as severely weakening. |

|
| FIGURE 2: SMH VOLUME, MONTHLY. This chart shows the OBV of the Semiconductor HOLDRS ETF in the lower pane, and the momentum and rate of change indicators of OBV in the upper panes. |
| Graphic provided by: MetaStock. |
| |
| In both examples, the exact same momentum indicator and ROC indicators were used. In both examples, the ROC indicator gave the correct analysis, but the momentum indicator did not. When OBV is positive, the momentum indicator provides a correct analysis. However, when OBV is negative, the momentum indicator gives a false report. To avoid using the wrong momentum indicator when analyzing the momentum of the OBV, you may want to consistently use the ROC indicator when analyzing the momentum of the OBV. This way, it will not matter if OBV is positive or negative, as the analyst will always arrive at the correct analysis. |
Alan Northam lives in the Dallas, Texas area and as an electronic engineer gave him an analytical mind from which he has developed a thorough knowledge of stock market technical analysis. His abilities to analyze the future direction of the stock market has allowed him to successfully trade of his own portfolio over the last 30 years. Mr. Northam is now retired and trading the stock market full time. You can reach him at inquiry@tradersclassroom.com or by visiting his website at http://www.tradersclassroom.com. You can also follow him on Twitter @TradersClassrm.
| Garland, Tx | |
| Website: | www.tradersclassroom.com |
| E-mail address: | inquiry@tradersclassroom.com |
Click here for more information about our publications!
Comments
Date: 07/15/10Rank: 3Comment:

|

Request Information From Our Sponsors
- StockCharts.com, Inc.
- Candle Patterns
- Candlestick Charting Explained
- Intermarket Technical Analysis
- John Murphy on Chart Analysis
- John Murphy's Chart Pattern Recognition
- John Murphy's Market Message
- MurphyExplainsMarketAnalysis-Intermarket Analysis
- MurphyExplainsMarketAnalysis-Visual Analysis
- StockCharts.com
- Technical Analysis of the Financial Markets
- The Visual Investor
- VectorVest, Inc.
- Executive Premier Workshop
- One-Day Options Course
- OptionsPro
- Retirement Income Workshop
- Sure-Fire Trading Systems (VectorVest, Inc.)
- Trading as a Business Workshop
- VectorVest 7 EOD
- VectorVest 7 RealTime/IntraDay
- VectorVest AutoTester
- VectorVest Educational Services
- VectorVest OnLine
- VectorVest Options Analyzer
- VectorVest ProGraphics v6.0
- VectorVest ProTrader 7
- VectorVest RealTime Derby Tool
- VectorVest Simulator
- VectorVest Variator
- VectorVest Watchdog
