HOT TOPICS LIST
- MACD
- Fibonacci
- RSI
- Gann
- ADXR
- Stochastics
- Volume
- Triangles
- Futures
- Cycles
- Volatility
- ZIGZAG
- MESA
- Retracement
- Aroon
INDICATORS LIST
LIST OF TOPICS
PRINT THIS ARTICLE
by Austin Passamonte
In the last two years, the Market Volatility Index has been successful in predicting future moves in the broad indices.
Position: N/A
Austin Passamonte
Austin is a private trader who trades emini stock index futures intraday. He currently trades various futures markets from home in addition to managing a trader's educational forum
PRINT THIS ARTICLE
VOLATILITY
Vexing VIX
01/14/02 01:37:52 PMby Austin Passamonte
In the last two years, the Market Volatility Index has been successful in predicting future moves in the broad indices.
Position: N/A
| Have you noticed how market volatility has greatly calmed since multi-year extreme spikes last September? Price action has rallied greatly from recent lows and the VIX has shed more than 30 index points, a greater amount than it usually measures! |
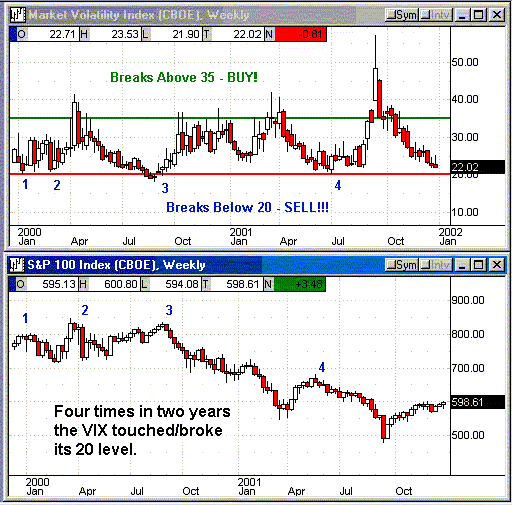
| That is true right now as we see the VIX sinking lower towards its 20 level, perhaps reaching it soon. Of what significance is this? Only four times in the past two years combined have we reached this extreme measure of market complacency. |

|
| Figure 1: Weekly Charts: VIX/OEX |
| Graphic provided by: Quote.com. |
| Graphic provided by: QCharts. |
| |
| Buy & hold traders have one major, vital sentiment tool to watch right now: the VIX right near its 22 level. That is not a trade signal just yet, but should it fall to 20 (or better yet below) one needs to exit all bullish plays or at the very least protect them from downside risk. |
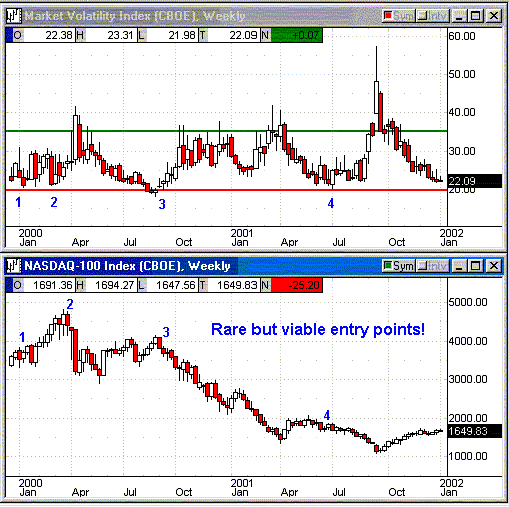
 Figure 2: Weekly Charts: NDX & VIX In its history that I've researched, a VIX reading of 20 or lower followed by a rise in its price marks significant market tops for ALL major indexes including the NDX, Dow and S&Ps. Nothing we truly love more than buy & hold "sure thing" trades. Using broad-market index put options long or selling call options and iShares short whenever the VIX touches or breaches that magical 20 level has been money in the bank every time we've seen it the past several years. These calm periods in market volatility do not come around very often, but they do suggest the next extreme will be increased volatility ahead. That takes a catalyst to spark the action and history proves downside direction is by far the highest-odds bet when it arrives! |
Austin is a private trader who trades emini stock index futures intraday. He currently trades various futures markets from home in addition to managing a trader's educational forum
| Title: | Individual Trader |
| Company: | CoiledMarkets.com |
| Address: | PO Box 633 |
| Naples, NY 14512 | |
| Website: | coiledmarkets.com/blog |
| E-mail address: | austinp44@yahoo.com |
Traders' Resource Links | |
| CoiledMarkets.com has not added any product or service information to TRADERS' RESOURCE. | |
Click here for more information about our publications!
Comments
Date: 01/14/02Rank: 4Comment:
Date: 01/15/02Rank: 4Comment: The author makes good observations in comparing VIX to other market indices. However, the two year period picked for analysis is rather short. It would have been more meaningful and convincing had the comparisions expanded over a 5-10 year period.
Date: 01/15/02Rank: 2Comment:
Date: 01/15/02Rank: 5Comment:
Date: 01/15/02Rank: 5Comment:
Date: 01/15/02Rank: Comment: Hi,
Interesting article. Where do you get the VIX chart? I went to CBOE site but could not see it.
Thank you.
Date: 01/15/02Rank: 4Comment:
Date: 01/16/02Rank: 4Comment:
Date: 01/16/02Rank: 5Comment:
Date: 01/23/02Rank: 4Comment:
Date: 04/03/02Rank: 5Comment:
Date: 04/25/02Rank: 5Comment: very good, wish to wrote more of these comments for the vix, qqv, vxn. thanks.

Request Information From Our Sponsors
- VectorVest, Inc.
- Executive Premier Workshop
- One-Day Options Course
- OptionsPro
- Retirement Income Workshop
- Sure-Fire Trading Systems (VectorVest, Inc.)
- Trading as a Business Workshop
- VectorVest 7 EOD
- VectorVest 7 RealTime/IntraDay
- VectorVest AutoTester
- VectorVest Educational Services
- VectorVest OnLine
- VectorVest Options Analyzer
- VectorVest ProGraphics v6.0
- VectorVest ProTrader 7
- VectorVest RealTime Derby Tool
- VectorVest Simulator
- VectorVest Variator
- VectorVest Watchdog
- StockCharts.com, Inc.
- Candle Patterns
- Candlestick Charting Explained
- Intermarket Technical Analysis
- John Murphy on Chart Analysis
- John Murphy's Chart Pattern Recognition
- John Murphy's Market Message
- MurphyExplainsMarketAnalysis-Intermarket Analysis
- MurphyExplainsMarketAnalysis-Visual Analysis
- StockCharts.com
- Technical Analysis of the Financial Markets
- The Visual Investor
