HOT TOPICS LIST
- MACD
- Fibonacci
- RSI
- Gann
- ADXR
- Stochastics
- Volume
- Triangles
- Futures
- Cycles
- Volatility
- ZIGZAG
- MESA
- Retracement
- Aroon
INDICATORS LIST
LIST OF TOPICS
PRINT THIS ARTICLE
by Ranjan Jha, CMT
The global shipping index may provide a clue about how Dow Jones Transportation Index will perform in the coming days.
Position: N/A
Ranjan Jha, CMT
I am a member of the Market Technicians Association and manage a limited partnership investment club in Virginia. Always seek advice from your own Financial Advisor before acting on any method outlined here since every circumstance is different.
PRINT THIS ARTICLE
CHART ANALYSIS
Baltic Dry Index Leads Dow Jones Transportation Average
07/12/10 01:28:15 PMby Ranjan Jha, CMT
The global shipping index may provide a clue about how Dow Jones Transportation Index will perform in the coming days.
Position: N/A
| The Dow Jones Transportation Average (DJTA) is a widely followed gauge of the US transportation sector. It includes several railroads, airlines (both cargo and passenger), marine transportation, and trucking companies. On the global front, the Baltic Dry Index (BDI) tracks worldwide international shipping prices of various dry bulk items including coal, iron ore, and grain. |
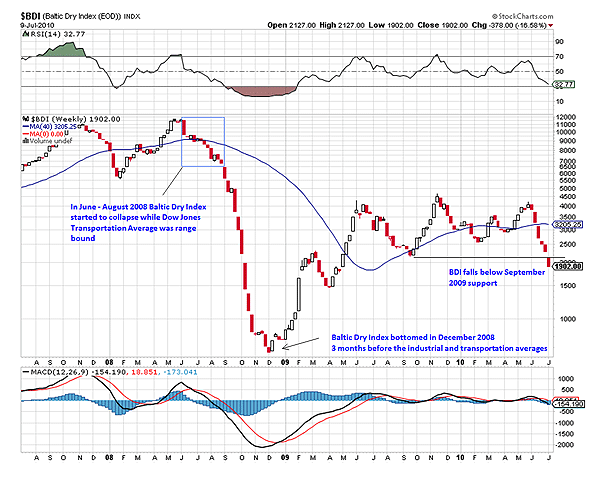
| Figure 1 shows a weekly chart of the BDI. Since the beginning of June 2010, the Baltic Dry Index has fallen more than 50%. It has relentlessly moved down for six weeks in a row, and last week, it gapped below its September 2009 support. As of Friday, July 9, it had made a fresh 52-week low, sitting below 2000. |

|
| FIGURE 1: BDI, WEEKLY. Now itís at its 52-week low. |
| Graphic provided by: StockCharts.com. |
| |
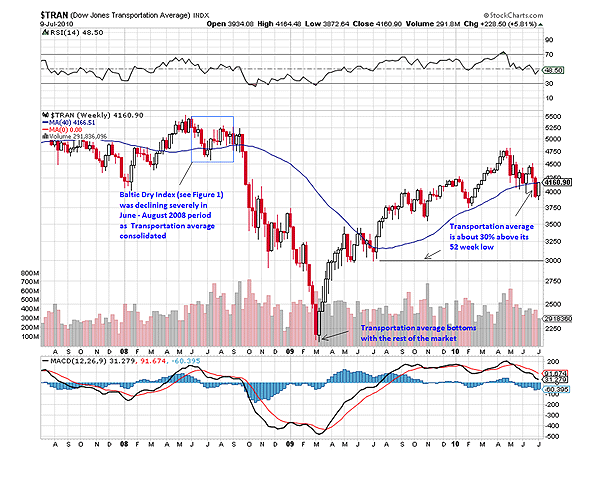
| Figure 2 shows a weekly chart of DJTA. It is about 12% off of its 52-week high. Recently, it moved higher with Dow Jones Industrial Average (DJIA) and claimed its 40-week line, which approximates a 200-day moving average. |

|
| FIGURE 2: DJTA, WEEKLY. Unlike BDI, it is closer to its 52-week high. |
| Graphic provided by: StockCharts.com. |
| |
| Comparing Figures 1 and 2, we see that prior to the market crash in late 2008, BDI had fallen substantially in the June-August 2008 period. During the same time, the DJTA was essentially consolidating. Starting September 2008, BDI intensified its downward move and very soon DJTA also collapsed. Moving forward, BDI made its low in early December 2008 and began to move higher. By March 2009, when DJTA made its low along with the DJIA, the BDI was well off its lows. After that, BDI made its 52-week high in the middle of November 2009. The DJTA showed a lag on this front as well and made its 52-week high much later in April 2010. At present, when BDI is in a severe decline week after week, the DJTA appears to be insulated. One view why is that lower international shipping rates are due to more ships in the market to haul cargo. But recent chart patterns clearly show that BDI tends to lead the DJTA. To protect any long position in the transportation sector, the BDI should be closely followed. If it continues on its downward journey in the coming days, then chances are high the DJTA will follow suit. |
I am a member of the Market Technicians Association and manage a limited partnership investment club in Virginia. Always seek advice from your own Financial Advisor before acting on any method outlined here since every circumstance is different.
| Address: | 2039 Stone Mill Drive |
| Salem, VA 24153 | |
| Phone # for sales: | 540-330-2911 |
| E-mail address: | ranjanjha@hotmail.com |
Click here for more information about our publications!
Comments

Request Information From Our Sponsors
- StockCharts.com, Inc.
- Candle Patterns
- Candlestick Charting Explained
- Intermarket Technical Analysis
- John Murphy on Chart Analysis
- John Murphy's Chart Pattern Recognition
- John Murphy's Market Message
- MurphyExplainsMarketAnalysis-Intermarket Analysis
- MurphyExplainsMarketAnalysis-Visual Analysis
- StockCharts.com
- Technical Analysis of the Financial Markets
- The Visual Investor
- VectorVest, Inc.
- Executive Premier Workshop
- One-Day Options Course
- OptionsPro
- Retirement Income Workshop
- Sure-Fire Trading Systems (VectorVest, Inc.)
- Trading as a Business Workshop
- VectorVest 7 EOD
- VectorVest 7 RealTime/IntraDay
- VectorVest AutoTester
- VectorVest Educational Services
- VectorVest OnLine
- VectorVest Options Analyzer
- VectorVest ProGraphics v6.0
- VectorVest ProTrader 7
- VectorVest RealTime Derby Tool
- VectorVest Simulator
- VectorVest Variator
- VectorVest Watchdog
