

HOT TOPICS LIST
- MACD
- Fibonacci
- RSI
- Gann
- ADXR
- Stochastics
- Volume
- Triangles
- Futures
- Cycles
- Volatility
- ZIGZAG
- MESA
- Retracement
- Aroon
INDICATORS LIST
LIST OF TOPICS
PRINT THIS ARTICLE
by Koos van der Merwe
Traders are always looking for a strategy that will give them consistent profits, no matter which direction the market is going. Here's one that you may approve of.
Position: Buy
Koos van der Merwe
Has been a technical analyst since 1969, and has worked as a futures and options trader with First Financial Futures in Johannesburg, South Africa.
PRINT THIS ARTICLE
TECHNICAL INDICATORS
Looking For A Consistent, Profitable Trading Strategy?
07/09/10 09:11:39 AMby Koos van der Merwe
Traders are always looking for a strategy that will give them consistent profits, no matter which direction the market is going. Here's one that you may approve of.
Position: Buy
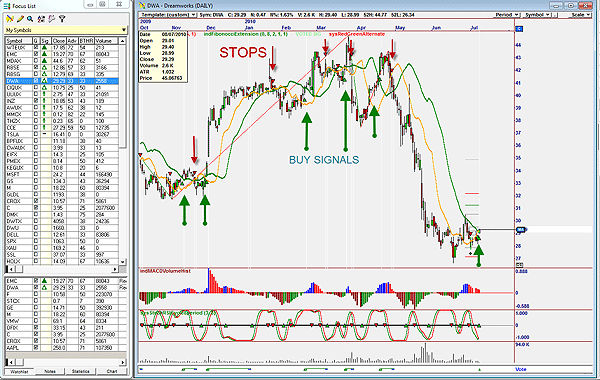
| The market is on the way to recovery. A nice statement to make, but a difficult one to absorb when all the pundits on TV talk "bear," What stocks should you buy? During the Great Depression, Sir John Templeton borrowed as much money as he could and bought 100 shares of every company he liked. His gamble paid off handsomely. Another way is to use a tried-and-true technical analysis strategy that you have tested and spent hours improving, and above all are happy with. The challenge, of course is, to trust that strategy and never become married to any particular stock. Easier said than done. We all love Apple Inc. shares at the moment, but is it a share we should own? The strategy I have spent hours working on and formulated for OmniTrader, a program I enjoy using but have adjusted to my parameters, is called the red/green strategy. You buy when the close rises above the high of 11 days ago, and you short (that is, stop out) when the close falls below the low of six days ago. Sounds too simple? Look at Figure 1. |
|
| FIGURE 1: REDS AND GREENS. Here are the buys and stops of the red/green strategy. |
| Graphic provided by: OmniTrader. |
| |
| I show the focus list, which lists all the shares I watch, and I backtest using the strategy to give me buy signals. As you can see, the focus list is suggesting WTEUX (Westshore Terminals; on the Toronto market, WTE.UN-T), EMC Corp. (EMC), MDAX (Macdonald Dettwiller) as definite buys, and RBSE (Royal Bank of Scotland Preferred Share E), RBSG (Royal Bank of Scotland Preferred Share G), DWA (DreamWorks), and CIQUX (Canadian High Income Equity Fund CIQ.UN-T) as future buys. I chose DreamWorks to analyze, probably because I am going against the major rule — I simply love their movies. Figure 1 shows the red (orange) green lines superimposed on the candlestick price. It also shows the indicators, moving average convergence/divergence (MACD) volume histogram and stochastic relative strength index (RSI) cycle eight-period indicator. Both are visual confirmation indicators; for example, if the red/green strategy gives me a buy, I will only buy when the MACD volume histogram is below or at the zero line, or is in buy mode (green or blue histogram), or the stochastic RSI cycle indicator is suggesting a buy. I have programmed the vote line so my stop is a break below the orange (red line of the R/G strategy) line. The chart does not show short positions — that is, a break below the orange (red) line of the red/green strategy. Admittedly, buy signals are not given exactly at market bottoms but as the share price rises, so the risk of a wrong trade is reduced. Visual inspection of the chart does look good, and results of portfolios I have run using this strategy are very good. |
Has been a technical analyst since 1969, and has worked as a futures and options trader with First Financial Futures in Johannesburg, South Africa.
| Address: | 3256 West 24th Ave |
| Vancouver, BC | |
| Phone # for sales: | 6042634214 |
| E-mail address: | petroosp@gmail.com |
Click here for more information about our publications!
Comments
Date:�07/14/10Rank:�5Comment:�

Request Information From Our Sponsors
- StockCharts.com, Inc.
- Candle Patterns
- Candlestick Charting Explained
- Intermarket Technical Analysis
- John Murphy on Chart Analysis
- John Murphy's Chart Pattern Recognition
- John Murphy's Market Message
- MurphyExplainsMarketAnalysis-Intermarket Analysis
- MurphyExplainsMarketAnalysis-Visual Analysis
- StockCharts.com
- Technical Analysis of the Financial Markets
- The Visual Investor
- VectorVest, Inc.
- Executive Premier Workshop
- One-Day Options Course
- OptionsPro
- Retirement Income Workshop
- Sure-Fire Trading Systems (VectorVest, Inc.)
- Trading as a Business Workshop
- VectorVest 7 EOD
- VectorVest 7 RealTime/IntraDay
- VectorVest AutoTester
- VectorVest Educational Services
- VectorVest OnLine
- VectorVest Options Analyzer
- VectorVest ProGraphics v6.0
- VectorVest ProTrader 7
- VectorVest RealTime Derby Tool
- VectorVest Simulator
- VectorVest Variator
- VectorVest Watchdog