HOT TOPICS LIST
- MACD
- Fibonacci
- RSI
- Gann
- ADXR
- Stochastics
- Volume
- Triangles
- Futures
- Cycles
- Volatility
- ZIGZAG
- MESA
- Retracement
- Aroon
INDICATORS LIST
LIST OF TOPICS
PRINT THIS ARTICLE
by Donald W. Pendergast, Jr.
The bear market continues to soldier on, but a fast-approaching, critical support level may prove to be a significant battleground between hard-core bears and value-conscious long-term investors.
Position: Sell
Donald W. Pendergast, Jr.
Donald W. Pendergast is a financial markets consultant who offers specialized services to stock brokers and high net worth individuals who seek a better bottom line for their portfolios.
PRINT THIS ARTICLE
SUPPORT & RESISTANCE
Russell 2000 Approaches Make-Or-Break Support
07/02/10 09:12:37 AMby Donald W. Pendergast, Jr.
The bear market continues to soldier on, but a fast-approaching, critical support level may prove to be a significant battleground between hard-core bears and value-conscious long-term investors.
Position: Sell
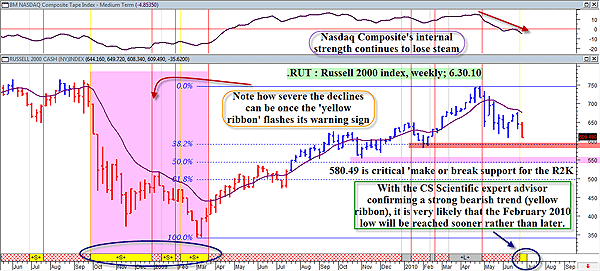
| Down about 18% since peaking in late April 2010, the Russell 2000 is now only 29 points above a very important support level, one that, if it were violated, might unleash further waves of selling frenzy in the highly volatile small-cap stocks that populate this particular stock index. Here's a look at the R2K's weekly chart (Figure 1), where things aren't looking all that hopeful for a near-term summer rally. |

|
| FIGURE 1: RUSSELL 2000, WEEKLY. With weak internal strength readings in each of the major stock indexes, the appearance of a new CS Scientific "sell short" alert (yellow ribbons) should be sounding a clear warning to investors and traders everywhere. |
| Graphic provided by: MetaStock. |
| Graphic provided by: CS Scientific Expert Advisor from MetaStock. |
| |
| With the R2K already having made quick work of the first-level 23.4% Fibonacci retracement of the epic March 2009 to April 2010 bull run, it now appears to have its sights set on reaching the 38.2% Fib retracement at 591.00. The fact that the R2K is already down more than 40 points seems to imply a sense of urgency among small-cap investors to dump as much stock as they can before a possible break of major support at 580.49, the area of the major weekly low in February 2010. Helping speed up the decline, no doubt, is the appearance of the MetaStock expert advisor's "sell short" yellow ribbon (blue ovals at bottom of chart). Look how far and fast the R2K shed value the last few times this expert advisor warned investors that it might be time to sell long positions and to go short instead. While we don't know if this index has another 2008-style selloff in the works, it would still be a wise move to get to the safety of cash as soon as possible, at least until we see what happens if 580.49 is hit anytime soon. Finally, note the indicator at the top of the chart, one that measures all of the critical internal strength measures of the NASDAQ Composite index. It's falling fast with heavy downward momentum pressing down on it. Taken as a whole, the entire image presented here is very negative and could even be viewed as a possible warning of even more severe declines to come. |

|
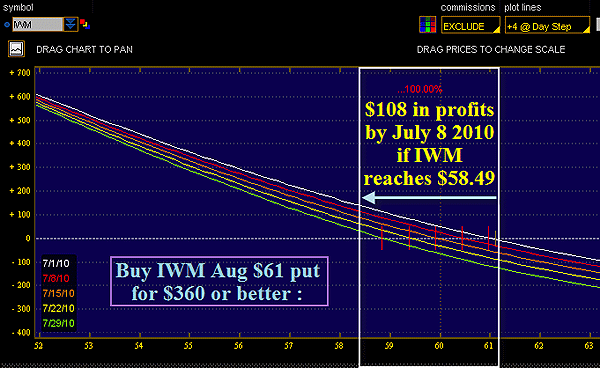
| FIGURE 2: IWM. With a delta of (-0.47), the IWM August $61 put option appears to provide a decent balance between profit potential and initial cash outlay. If IWM is going to test the $58.49 support level, it is likely to do so long before this option expires, about 50 days from now. |
| Graphic provided by: Thinkorswim. |
| |
| Figure 2 shows a long put play, one that might produce a nice profit if the R2K continues to fall: Buy 1 August 2010 IWM 61 put --------------------------- Net debit of 3.60 or less ($360) The big idea here is capitalize on the very high probability that the Russell 2000 will indeed soon test critical support in the 580.00 area. If the index reaches that price target by July 8, 2010, this option trade stands to make about $109 before commissions, possibly a bit more if implied volatility (IV) continues to increase on a panic move lower. Conversely, if IWM rises to $63.50 by that same date, owners of this August $61 put would be down about $132 before commissions. As in all things option related, you always want to put as many probabilities in your favor as possible, and this particular trade has plenty of bearish firepower aligned in its intended flight path down toward 580.49 on the R2K. If that support level is hit, consider taking at least half of your long put position off (and all of it off if you only bought one $61 put) and then closely trailing the rest until you see if 580.00 is going to hold. For most traders, the opportunity to make about 30% on your investment in a week or two is still a pretty good deal (if the trade works as planned, that is) and most traders should just take profits at support and be thankful for their blessings. In that way, they can likely avoid getting caught in any short-covering rallies (they tend to occur near key chart support levels, and this one at 580.49 is a real biggie), sharp reversals that can absolutely decimate a heavily positioned long put holder who isn't paying enough attention to the markets. |
Donald W. Pendergast is a financial markets consultant who offers specialized services to stock brokers and high net worth individuals who seek a better bottom line for their portfolios.
| Title: | Writer, market consultant |
| Company: | Linear Trading Systems LLC |
| Jacksonville, FL 32217 | |
| Phone # for sales: | 904-239-9564 |
| E-mail address: | lineartradingsys@gmail.com |
Traders' Resource Links | |
| Linear Trading Systems LLC has not added any product or service information to TRADERS' RESOURCE. | |
Click here for more information about our publications!
PRINT THIS ARTICLE

Request Information From Our Sponsors
- StockCharts.com, Inc.
- Candle Patterns
- Candlestick Charting Explained
- Intermarket Technical Analysis
- John Murphy on Chart Analysis
- John Murphy's Chart Pattern Recognition
- John Murphy's Market Message
- MurphyExplainsMarketAnalysis-Intermarket Analysis
- MurphyExplainsMarketAnalysis-Visual Analysis
- StockCharts.com
- Technical Analysis of the Financial Markets
- The Visual Investor
- VectorVest, Inc.
- Executive Premier Workshop
- One-Day Options Course
- OptionsPro
- Retirement Income Workshop
- Sure-Fire Trading Systems (VectorVest, Inc.)
- Trading as a Business Workshop
- VectorVest 7 EOD
- VectorVest 7 RealTime/IntraDay
- VectorVest AutoTester
- VectorVest Educational Services
- VectorVest OnLine
- VectorVest Options Analyzer
- VectorVest ProGraphics v6.0
- VectorVest ProTrader 7
- VectorVest RealTime Derby Tool
- VectorVest Simulator
- VectorVest Variator
- VectorVest Watchdog
