HOT TOPICS LIST
- MACD
- Fibonacci
- RSI
- Gann
- ADXR
- Stochastics
- Volume
- Triangles
- Futures
- Cycles
- Volatility
- ZIGZAG
- MESA
- Retracement
- Aroon
INDICATORS LIST
LIST OF TOPICS
PRINT THIS ARTICLE
by James Kupfer
The major market indexes are nearing a critical juncture that will lead to either a minor rally or a significant fall. But which one?
Position: Hold
James Kupfer
Mr. Kupfer is a market professional and amateur stock market commentator. Disclosure: It is likely that Mr. Kupfer has or will enter a position in any security he writes about.
PRINT THIS ARTICLE
STOCHASTIC OSCILL
Minor Rally Or Significant Fall For The S&P 500?
06/30/10 09:16:54 AMby James Kupfer
The major market indexes are nearing a critical juncture that will lead to either a minor rally or a significant fall. But which one?
Position: Hold
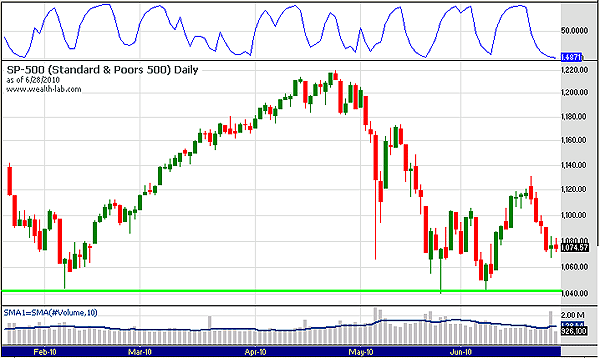
| The major equity markets appear to be in a precarious state, and now it's make-it-or-break-it time. Looking back through February 2010, we can see that the market held the February low shown by the green line (Figure 1). The Standard & Poor's 500 twice tested the 1040 level and held. Given the importance of these tests, it is imperative that the market stay above its current levels in order to continue rallying. |

|
| FIGURE 1: S&P 500, DAILY. The green line is critical support. If that breaks, look out below. |
| Graphic provided by: Wealth-Lab. |
| |
| We are at a critical juncture because the market is near the 1040 level and now deeply oversold. Looking at stochastics in the top panel, we can see the price tops and bottoms over the last few months. Now, the market is oversold and ripe for a bounce. That does not mean it will happen, but conditions are favorable for such a move. |

|
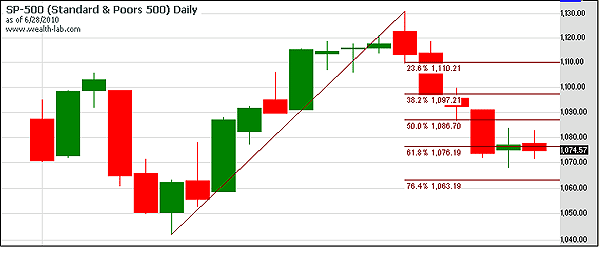
| FIGURE 2: S&P 500, DAILY. A Fibonacci retracement shows support at current price levels. |
| Graphic provided by: Wealth-Lab. |
| |
| Moving to a closer view of the S&P, we can see that the market is treading at the 61.8% Fibonacci support line (Figure 2). Given the confluence of support provided by this Fibonacci level and the oversold readings indicated by stochastics, this marks a logical spot for a meaningful bounce. And this is what makes the current price levels so important. If we move up from here, there is a very good chance that the market will create a series of higher highs and higher lows, thus putting us into a minor rally that would likely last a few weeks or longer. If the market continues to drop, the 1040 level is at risk and not likely to hold. If that were to fail, that would be indicative of a major correction beginning in the market. |
Mr. Kupfer is a market professional and amateur stock market commentator. Disclosure: It is likely that Mr. Kupfer has or will enter a position in any security he writes about.
Click here for more information about our publications!
PRINT THIS ARTICLE

Request Information From Our Sponsors
- StockCharts.com, Inc.
- Candle Patterns
- Candlestick Charting Explained
- Intermarket Technical Analysis
- John Murphy on Chart Analysis
- John Murphy's Chart Pattern Recognition
- John Murphy's Market Message
- MurphyExplainsMarketAnalysis-Intermarket Analysis
- MurphyExplainsMarketAnalysis-Visual Analysis
- StockCharts.com
- Technical Analysis of the Financial Markets
- The Visual Investor
- VectorVest, Inc.
- Executive Premier Workshop
- One-Day Options Course
- OptionsPro
- Retirement Income Workshop
- Sure-Fire Trading Systems (VectorVest, Inc.)
- Trading as a Business Workshop
- VectorVest 7 EOD
- VectorVest 7 RealTime/IntraDay
- VectorVest AutoTester
- VectorVest Educational Services
- VectorVest OnLine
- VectorVest Options Analyzer
- VectorVest ProGraphics v6.0
- VectorVest ProTrader 7
- VectorVest RealTime Derby Tool
- VectorVest Simulator
- VectorVest Variator
- VectorVest Watchdog
