HOT TOPICS LIST
- MACD
- Fibonacci
- RSI
- Gann
- ADXR
- Stochastics
- Volume
- Triangles
- Futures
- Cycles
- Volatility
- ZIGZAG
- MESA
- Retracement
- Aroon
INDICATORS LIST
LIST OF TOPICS
PRINT THIS ARTICLE
by Koos van der Merwe
I forecast that the Dow Jones Industrial Average would be completing a Wave II correction, with a Wave 1 of a Wave III to follow.
Position: N/A
Koos van der Merwe
Has been a technical analyst since 1969, and has worked as a futures and options trader with First Financial Futures in Johannesburg, South Africa.
PRINT THIS ARTICLE
ELLIOTT WAVE
Bull Or Bear?
06/28/10 09:17:39 AMby Koos van der Merwe
I forecast that the Dow Jones Industrial Average would be completing a Wave II correction, with a Wave 1 of a Wave III to follow.
Position: N/A
| Yes, I forecast that the Dow Jones Industrial Average (DJIA) would be completing a Wave II correction, with a Wave 1 of a Wave III to follow. What I did not take into account was the speed with which this would happen. With the "sell in May and go away" technique; with the summer rally; with so many bears in the market riding any and every fundamental and economic bad news hitting the wires, I thought that the market would move slowly, giving traders plenty of opportunity to prepare lists of stocks they would like to own, but my charts are telling me that I am wrong — I am too slow. We must believe in our charts, and not listen to the news or TV shows where they discuss anything and everything that means absolutely nothing, and jump to false conclusions. Be a technician and trust your charts. Do not become a fundamentalist. |

|
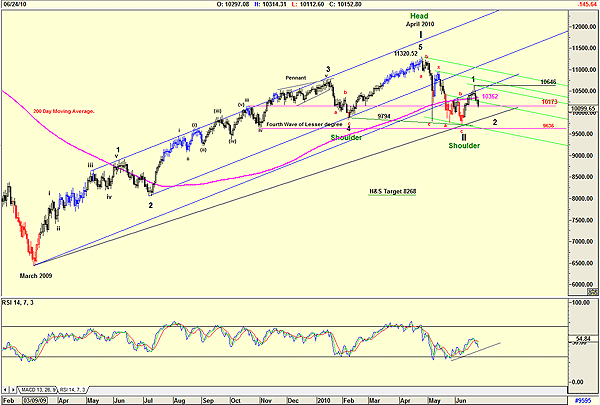
| FIGURE 1: DJIA, DAILY. Here's the DJIA showing possible bullish and bearish patterns. |
| Graphic provided by: AdvancedGET. |
| |
| Figure 1 is an Elliott wave count of the DJIA daily. It shows my preferred wave count suggesting that the DJIA is tracing a wave 2 of Wave III. This is disturbing for the following reasons: a. Wave II has bottomed in the fourth wave of lesser degree as shown. However, although my chart suggests that wave 1 and wave 2 of Wave III have formed, this move could change to part of an A-B-C correction of Wave II. I say this because the DJIA count is moving far faster than I expected. I thought that Wave II would only end sometime toward the end of September. This is because the correction of Wave I should by all accounts be a 38.2% time correction of the rise of Wave I from March 2009 until April 2010. The fact that the DJIA is retracing quicker than I anticipated is good news for the economy, but then we should never forget that the market always anticipates the economy. b. The support pivot point level is 9636, and a break below this level will force me to change my wave count to a bearish one, in line with Robert Prechter and other bears suggesting that a double-dip recession is a definite. Many of the bears are looking at the present formation as a head & shoulder pattern, with a target of 8268 (11320 - 9794 = 1526; 9794 - 1526 = 8268). c. My upper resistance pivot point level is 10646. Any move above this level will confirm my count that the DJIA is now in a very bullish Wave III. What supports my view is the relative strength index (RSI), which does look bullish. d. Do note how the DJIA is playing with the 200-day moving average, a fundamentalist's technical indicator. The DJIA is at a very decisive point at the moment. A move above 10646 will confirm a new bull market. A move below 9636 will establish a bear trend and cause me to change my wave count and apologize to Robert Prechter for doubting his analysis. A strong sustained move above the 200-day moving average at 10362 with a further move above 10646 will, on the other hand, put a spoke in the bear analysis. Time at the moment is very decisive. |
Has been a technical analyst since 1969, and has worked as a futures and options trader with First Financial Futures in Johannesburg, South Africa.
| Address: | 3256 West 24th Ave |
| Vancouver, BC | |
| Phone # for sales: | 6042634214 |
| E-mail address: | petroosp@gmail.com |
Click here for more information about our publications!
Comments
Date: 06/29/10Rank: 4Comment: Koos;
My fundamentals say that there is an 80% chance of a double dip recession. Our government is the worst I ve seen in all my voting years.
We ll see. My best to you. Dick Slayton

Request Information From Our Sponsors
- VectorVest, Inc.
- Executive Premier Workshop
- One-Day Options Course
- OptionsPro
- Retirement Income Workshop
- Sure-Fire Trading Systems (VectorVest, Inc.)
- Trading as a Business Workshop
- VectorVest 7 EOD
- VectorVest 7 RealTime/IntraDay
- VectorVest AutoTester
- VectorVest Educational Services
- VectorVest OnLine
- VectorVest Options Analyzer
- VectorVest ProGraphics v6.0
- VectorVest ProTrader 7
- VectorVest RealTime Derby Tool
- VectorVest Simulator
- VectorVest Variator
- VectorVest Watchdog
- StockCharts.com, Inc.
- Candle Patterns
- Candlestick Charting Explained
- Intermarket Technical Analysis
- John Murphy on Chart Analysis
- John Murphy's Chart Pattern Recognition
- John Murphy's Market Message
- MurphyExplainsMarketAnalysis-Intermarket Analysis
- MurphyExplainsMarketAnalysis-Visual Analysis
- StockCharts.com
- Technical Analysis of the Financial Markets
- The Visual Investor
