

HOT TOPICS LIST
- MACD
- Fibonacci
- RSI
- Gann
- ADXR
- Stochastics
- Volume
- Triangles
- Futures
- Cycles
- Volatility
- ZIGZAG
- MESA
- Retracement
- Aroon
INDICATORS LIST
LIST OF TOPICS
PRINT THIS ARTICLE
by Chaitali Mohile
The Commodity Related Equity Index is likely to lose the previous gains of the recovery rally.
Position: Sell
Chaitali Mohile
Active trader in the Indian stock markets since 2003 and a full-time writer. Trading is largely based upon technical analysis.
PRINT THIS ARTICLE
CANDLESTICK CHARTING
$CRX On Reverse Track
06/29/10 08:48:54 AMby Chaitali Mohile
The Commodity Related Equity Index is likely to lose the previous gains of the recovery rally.
Position: Sell
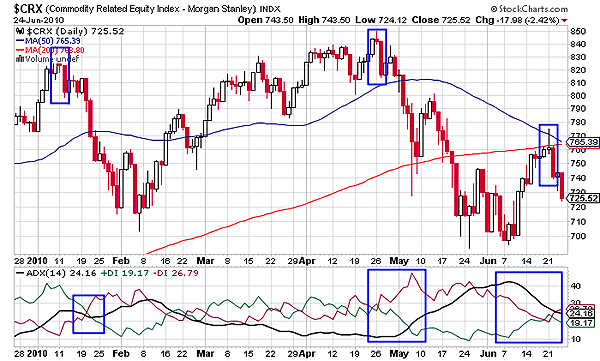
| The highly volatile Commodity Related Equity Index ($CRX) has always been ruled by bearish forces. Figure 1 is filled with long red candlesticks, indicating the bearish strength in the price rally. As a result, a downtrend keeps popping up after every bullish rally. The blue boxes show a cluster of three candles in similar sequence, with a bullish candle followed by a doji with small real body and a strong red bearish candle. Together, these three candles form an evening star candlestick pattern, which is a bearish reversal formation. We can see that the pattern formed at the top of the bullish rally. On the daily chart in Figure 1, the pattern first appeared in January 2010. Eventually, $CRX decelerated from 840 levels, developing an intermediate downtrend. The average directional movement index (ADX) (14) surged above 20 levels with a huge selling pressure. Thus, the evening star pattern initiated the fresh bearish trend. |
|
| FIGURE 1: $CRX, DAILY |
| Graphic provided by: StockCharts.com. |
| |
| The pattern appeared in April 2010 as well. The pullback rally from 703 made a higher high at 850 levels. Although the rally made a new high, the ADX (14) failed to develop a new uptrend. The evening star formation once again boosted the bearish strength, and so $CRX tumbled to a new low, to 692 levels. The bullish sentiments were damaged as the downside rally breached the 200-day moving average (MA) support. Meanwhile, the developing downtrend that reached an overheated level was ready to reverse. Thus, a pullback rally began with the target of 200-day MA resistance. |
| The third evening star pattern appeared at the 200-day MA resistance, indicating a robust bearish signal in the market. Another technical weakness in Figure 1 is the converging 200-day MA and the 50-day MA. The long-term MA (200-day) is ready to surge above the short-term MA. The ADX (14) shows the developing downtrend. Therefore, $CRX is resuming the downside journey, perhaps with a deeper cut this time. The prior low at 694 is the initial support level for the current rally. |
|
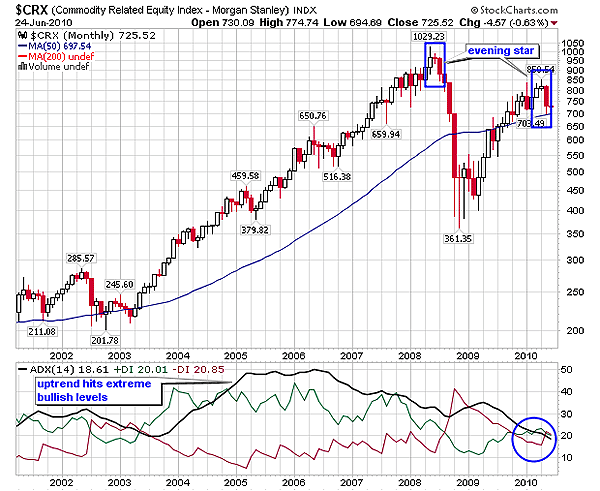
| FIGURE 2: $CRX, MONTHLY |
| Graphic provided by: StockCharts.com. |
| |
| The monthly time frame of $CRX has formed the evening star candlestick pattern. In Figure 2, the index formed the pattern with support at the 50-day MA. In 2008, the candlestick pattern initiated a serious corrective rally for the index and developed the robust long-term downtrend. This signifies strength in the pattern. The relief rally has gained the previous levels; however, the candlestick formation at the current levels is likely to discontinue the rally. After breaching the 50-day MA support, $CRX would retrace to the earlier low. Though the downtrend has descended, the ADX (14) has turned weak, and thus, $CRX is likely to violate the MA support seen in Figure 2. |
| Since the evening star candlestick pattern has appeared on two time frames, the previous gains of $CRX is under threat. |
Active trader in the Indian stock markets since 2003 and a full-time writer. Trading is largely based upon technical analysis.
| Company: | Independent |
| Address: | C1/3 Parth Indraprasth Towers. Vastrapur |
| Ahmedabad, Guj 380015 | |
| E-mail address: | chaitalimohile@yahoo.co.in |
Traders' Resource Links | |
| Independent has not added any product or service information to TRADERS' RESOURCE. | |
Click here for more information about our publications!
PRINT THIS ARTICLE

Request Information From Our Sponsors
- StockCharts.com, Inc.
- Candle Patterns
- Candlestick Charting Explained
- Intermarket Technical Analysis
- John Murphy on Chart Analysis
- John Murphy's Chart Pattern Recognition
- John Murphy's Market Message
- MurphyExplainsMarketAnalysis-Intermarket Analysis
- MurphyExplainsMarketAnalysis-Visual Analysis
- StockCharts.com
- Technical Analysis of the Financial Markets
- The Visual Investor
- VectorVest, Inc.
- Executive Premier Workshop
- One-Day Options Course
- OptionsPro
- Retirement Income Workshop
- Sure-Fire Trading Systems (VectorVest, Inc.)
- Trading as a Business Workshop
- VectorVest 7 EOD
- VectorVest 7 RealTime/IntraDay
- VectorVest AutoTester
- VectorVest Educational Services
- VectorVest OnLine
- VectorVest Options Analyzer
- VectorVest ProGraphics v6.0
- VectorVest ProTrader 7
- VectorVest RealTime Derby Tool
- VectorVest Simulator
- VectorVest Variator
- VectorVest Watchdog