

HOT TOPICS LIST
- MACD
- Fibonacci
- RSI
- Gann
- ADXR
- Stochastics
- Volume
- Triangles
- Futures
- Cycles
- Volatility
- ZIGZAG
- MESA
- Retracement
- Aroon
INDICATORS LIST
LIST OF TOPICS
PRINT THIS ARTICLE
by Billy Williams
Trends, expansion, and contraction -- what do all these have to do with Zion Bancorp?
Position: N/A
Billy Williams
Billy Williams has been trading the markets for 27 years, specializing in momentum trading with stocks and options.
PRINT THIS ARTICLE
TRIANGLES
Trading Bullish Triangle In ZION
06/25/10 04:16:31 PMby Billy Williams
Trends, expansion, and contraction -- what do all these have to do with Zion Bancorp?
Position: N/A
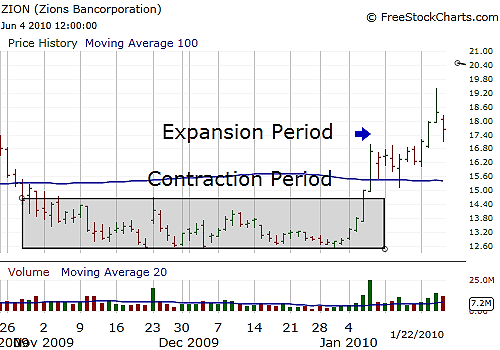
| Trend trading is one of the most reliable ways to make money at trading, but knowing when to enter a trend that is already in progress can be challenging. When trends are expanding, they tend to be explosive and can move so quickly that it can be daunting for traders to time their entries. Often, this is one of the contributing factors as to why some traders sit paralyzed on the sidelines, then kick themselves for not having the courage to follow through. This cycle is played out over and over again, but it doesn't have to happen to you. Understand that there are two types of price actions: expansion and contraction. Like yin and yang, these two opposites exist to complement each other and by undertanding their functions as well as the clues they leave behind, then you too can learn to trade in harmony with the movement of the market instead of being frustrated and left behind when a monster move takes off. Zions Bancorp (ZION) exhibited this type of price action and trade setup back in late November 2009 (Figure 1) when it found its bottom on November 20, set a significant high on November 23, and then contracted into a trading range up until January 6, 2010 when it broke out of its range on high volume. This breakout from a contracted price range set the stage for expansion and the beginning of a new trend to the upside. |
|
| FIGURE 1: CONTRACTION & EXPANSION |
| Graphic provided by: FreeStockCharts.com. |
| |
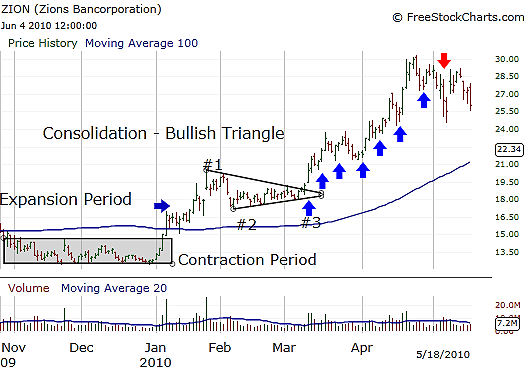
| Price continued to trend upward with solid momentum with a price high set on January 26, 2010, then followed by a low on February 5, 2010. Zigzagging back and forth, ZION's price action began to consolidate on lower volume as investors began to either take gains, reconsider holding their position, or contemplated whether to add to their positions or take fresh positions in the stock. |
|
| FIGURE 2: ZION, BULLISH SYMMETRICAL TRIANGLE TRADE |
| Graphic provided by: FreeStockCharts.com. |
| |
| Price broke through the bullish symmetrical triangle's upper trendline on March 8, 2010, on higher volume with where you could have entered on the close at $19.26 (Figure 2). Your money management strategy, in this example, would have been one point below each pivot low set in the stock's price action as it trended to the upside (the blue arrows indicate the trailing stop levels). The pivot low would be defined as the price bar that sets a significant low where the preceding price bar's low and the following price bar's low do not trade beneath its set low point. Your stop would be a point beneath each pivot low until price touched that stop order. This strategy would have kept you in the trade until May 5, 2010, when price traded below the low set on April 27, 2010, which was $27.30. Your stop-loss would have been hit at $26.30, leaving you a profit of $7.04, or a 36.6% gain and a 227% annualized gain. This type of market behavior is often reflected in a stock's price action, revealing the uncertainty felt by traders on the sidelines left to wonder whether the trend will continue and by traders/investors already in the stock but wondering if the stock will resume its trend. As these traders and investors are running these questions through their minds, the price action begins to form a chart pattern revealing their uncertainty but also setting up to resume the trend to the upside. |
| Bullish symmetrical triangles are typically continuation trends that occur regularly in the stock market just as in this example with ZION. Typically, they take about three weeks to form with upper and lower trendlines touching at least two price points, preferrably three, and entries are signaled when price trades through the upper trendline of the triangle, on higher volume. When timed right, experts say that the success rate can be as high as 94%, making this a very reliable pattern for you to learn and master. However, the risk is that price may prematurely break out on lower volume. Remember, you should only enter long when breakouts through the triangle's upper trendline are confirmed with higher volume. |
| In addition, price targets are calculated approximately the same vertical distance as the open end of the triangle, then set from the point of breakout that occurs through the upper trendline. By keeping these key points in mind, if you spend time scanning the markets for these opportunities, you will have a definite edge when trading the market. |
Billy Williams has been trading the markets for 27 years, specializing in momentum trading with stocks and options.
| Company: | StockOptionSystem.com |
| E-mail address: | stockoptionsystem.com@gmail.com |
Traders' Resource Links | |
| StockOptionSystem.com has not added any product or service information to TRADERS' RESOURCE. | |
Click here for more information about our publications!
Comments

Request Information From Our Sponsors
- StockCharts.com, Inc.
- Candle Patterns
- Candlestick Charting Explained
- Intermarket Technical Analysis
- John Murphy on Chart Analysis
- John Murphy's Chart Pattern Recognition
- John Murphy's Market Message
- MurphyExplainsMarketAnalysis-Intermarket Analysis
- MurphyExplainsMarketAnalysis-Visual Analysis
- StockCharts.com
- Technical Analysis of the Financial Markets
- The Visual Investor
- VectorVest, Inc.
- Executive Premier Workshop
- One-Day Options Course
- OptionsPro
- Retirement Income Workshop
- Sure-Fire Trading Systems (VectorVest, Inc.)
- Trading as a Business Workshop
- VectorVest 7 EOD
- VectorVest 7 RealTime/IntraDay
- VectorVest AutoTester
- VectorVest Educational Services
- VectorVest OnLine
- VectorVest Options Analyzer
- VectorVest ProGraphics v6.0
- VectorVest ProTrader 7
- VectorVest RealTime Derby Tool
- VectorVest Simulator
- VectorVest Variator
- VectorVest Watchdog