

HOT TOPICS LIST
- MACD
- Fibonacci
- RSI
- Gann
- ADXR
- Stochastics
- Volume
- Triangles
- Futures
- Cycles
- Volatility
- ZIGZAG
- MESA
- Retracement
- Aroon
INDICATORS LIST
LIST OF TOPICS
PRINT THIS ARTICLE
by Chaitali Mohile
The technical charts of the Gold & Silver Index have the potential of short-selling as well as for a long-term buy setup.
Position: Sell
Chaitali Mohile
Active trader in the Indian stock markets since 2003 and a full-time writer. Trading is largely based upon technical analysis.
PRINT THIS ARTICLE
CHART ANALYSIS
Gold & Silver Index In Bearish Mood?
06/25/10 11:24:49 AMby Chaitali Mohile
The technical charts of the Gold & Silver Index have the potential of short-selling as well as for a long-term buy setup.
Position: Sell
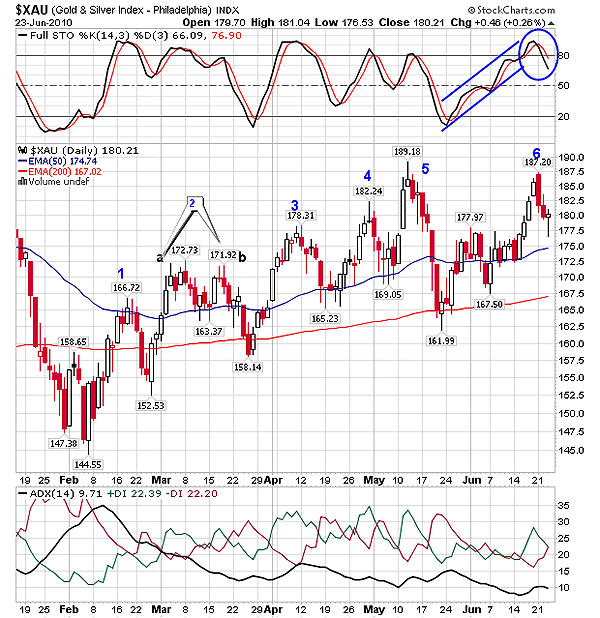
| The Gold & Silver Index-Philadelphia ($XAU) has been rallying with the support of 200-day and 50-day exponential moving average (EMA). Since February 2010, the index formed nearly six higher tops. At each new high, the index retraced to test either of the EMA supports, forming higher lows. The point to be highlighted here is that the index generated some of the other bearish reversal candlestick signals at the top. In Figure 1, all six peaks are marked from 1 to 6. Peak #1 shows an evening star candlestick pattern under the resistance of the 50-day EMA. The index plunged below the 200-day EMA support. The second higher high formed a short-term double top formation, but each peak indicated a top formation. At 2a there were candles with long upper shadows and at 2b once again an evening star pattern was formed. The index dropped from 171 to 158. The third top in Figure 1 is a cluster of doji candlesticks, suggesting a lack of confidence and indecision among traders. However, this fall was not as severe as the earlier; $XAU corrected only 13 points from the top. |
|
| FIGURE 1: $XAU, DAILY. The charts show various bearish reversal candlestick patterns formed at higher highs. |
| Graphic provided by: StockCharts.com. |
| |
| Peak #4 is a dragonfly doji and #5 is a shooting star candlestick pattern. The corrective rally from peak #5 was the strongest of all the bearish moves initiated from the earlier tops; $XAU lost nearly 29 points from 189 levels. The most recent peak, #6, is forming a bearish engulfing pattern at the top. The red candle is huge, indicating robust bearish strength that can damage the current bullish move. The full stochastic (14,3,3) is ready to dive into a bearish zone below the 50 levels. The average directional movement index (ADX) (14) has turned weaker by moving below 9. However, traders need to see the length of the actual fall as the index formed, as the ascending 50-day EMA support has moved to 175 levels. Therefore, current short positions can be booked partially near this support line; watch for the next action on the price chart in Figure 1. |
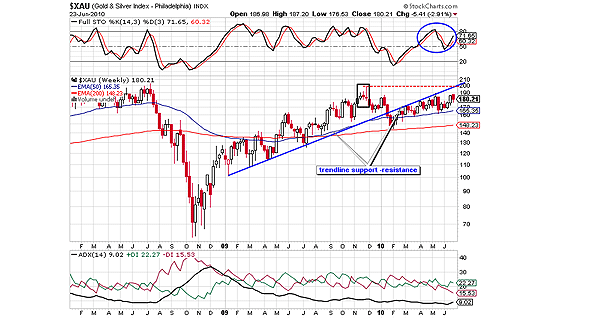
| On the weekly chart in Figure 2, a trendline is drawn, joining all the higher lows of 2009. After extending the trendline to the right side of the chart, the same support line turns into sharp resistance for $XAU. The ascending rally of 2010 rallied between the support of the 50-day EMA and trendline resistance. The previous high (see box in Figure 2) and the trendline show future resistance for $XAU near 198/200 levels. For the current bearish phase, the index is likely to challenge the 50-day EMA support at 165. The stochastic oscillator is shaky in the bullish area between 50 and 70 levels, suggesting stability of the ascending rally. But the ADX (14) is tricky as it has moved to 9 levels with unsteady selling and buying pressures. Therefore, the long-term upward rally would be a little jittery. |
|
| FIGURE 2: $XAU, WEEKLY. The trendline drawn by joining the three consecutive higher lows turned to resistance. |
| Graphic provided by: StockCharts.com. |
| |
| However, various trading options could be generated during this ascending move. Traders can follow the range between the trendline resistance and the 50-day EMA in Figure 2. Since the index is undergoing the bearish rally, the gold stock would come under the similar pressure. Thus, fresh short positions can be triggered until the index establishes support on the technical charts. The trendline resistance shows a long-term bullish target at 198/200 levels. |
Active trader in the Indian stock markets since 2003 and a full-time writer. Trading is largely based upon technical analysis.
| Company: | Independent |
| Address: | C1/3 Parth Indraprasth Towers. Vastrapur |
| Ahmedabad, Guj 380015 | |
| E-mail address: | chaitalimohile@yahoo.co.in |
Traders' Resource Links | |
| Independent has not added any product or service information to TRADERS' RESOURCE. | |
Click here for more information about our publications!
PRINT THIS ARTICLE

Request Information From Our Sponsors
- StockCharts.com, Inc.
- Candle Patterns
- Candlestick Charting Explained
- Intermarket Technical Analysis
- John Murphy on Chart Analysis
- John Murphy's Chart Pattern Recognition
- John Murphy's Market Message
- MurphyExplainsMarketAnalysis-Intermarket Analysis
- MurphyExplainsMarketAnalysis-Visual Analysis
- StockCharts.com
- Technical Analysis of the Financial Markets
- The Visual Investor
- VectorVest, Inc.
- Executive Premier Workshop
- One-Day Options Course
- OptionsPro
- Retirement Income Workshop
- Sure-Fire Trading Systems (VectorVest, Inc.)
- Trading as a Business Workshop
- VectorVest 7 EOD
- VectorVest 7 RealTime/IntraDay
- VectorVest AutoTester
- VectorVest Educational Services
- VectorVest OnLine
- VectorVest Options Analyzer
- VectorVest ProGraphics v6.0
- VectorVest ProTrader 7
- VectorVest RealTime Derby Tool
- VectorVest Simulator
- VectorVest Variator
- VectorVest Watchdog