HOT TOPICS LIST
- MACD
- Fibonacci
- RSI
- Gann
- ADXR
- Stochastics
- Volume
- Triangles
- Futures
- Cycles
- Volatility
- ZIGZAG
- MESA
- Retracement
- Aroon
INDICATORS LIST
LIST OF TOPICS
PRINT THIS ARTICLE
by Chaitali Mohile
QQQQ is the most traded and most followed stock in the US financial market. The long-term view of the stock is likely to be healthier than the current turbulence.
Position: N/A
Chaitali Mohile
Active trader in the Indian stock markets since 2003 and a full-time writer. Trading is largely based upon technical analysis.
PRINT THIS ARTICLE
SUPPORT & RESISTANCE
QQQQ Reluctant To Breach Resistance
06/25/10 11:04:00 AMby Chaitali Mohile
QQQQ is the most traded and most followed stock in the US financial market. The long-term view of the stock is likely to be healthier than the current turbulence.
Position: N/A
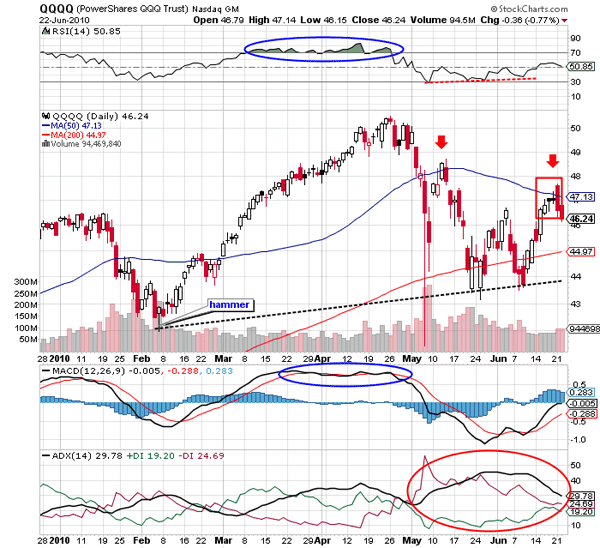
| In early February 2010, the PowerShare QQQ (QQQQ) Trust began a fresh bullish rally. The stock formed a small hammer candlestick pattern at the bottom of the chart near 42 levels. QQQQ violated the 50-day moving average (MA) resistance, and later reversed the downtrend. The average directional movement index (ADX) (14) confirmed a developing bullish trend in Figure 1. The advance rally consolidated at $50, indicating reluctance to surge higher. An overbought relative strength index (RSI) (14) formed a lower peak, and the moving average convergence/divergence (MACD) (12,26,9) merged with the trigger line in Figure 1. This suggested that the rally is losing bullish strength. Thus, QQQQ drifted below the 50-day MA support, and gradually formed higher bottom below $44. |

|
| FIGURE 1: QQQQ, DAILY. The stock lacks strength to breach the 200-day MA resistance. |
| Graphic provided by: StockCharts.com. |
| |
| The ranging RSI (14) indicated that there is a strong possibility of a downtrend developing. QQQQ dropped, forming a higher low. The black dotted line shows the three consecutive higher lows. The higher bottom formation signals future bullish action on the technical chart. This indication was solidly confirmed by the descending downtrend. Note that a fresh relief rally was initiated. Currently, QQQQ has hit the 50-day MA resistance but seems reluctant to breach the resistance. The MA resistance was also challenged earlier in May; see the red arrow in Figure 1. The stock is undergoing similar pressure at current levels. The large red candles and small doji candlesticks reflect the bearish strength in QQQQ. Thus, the stock is likely to retrace to the trendline support. Here, traders can trigger short positions with the target of $44. |

|
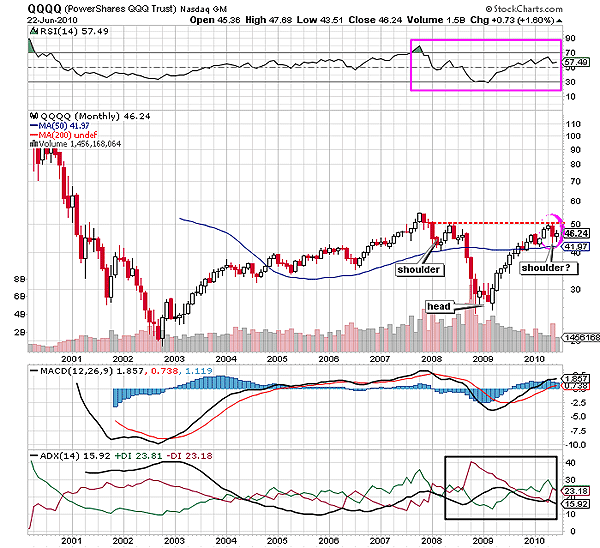
| FIGURE 2: QQQQ, MONTHLY. The future target of the inverted head & shoulders breakout is $75. |
| Graphic provided by: StockCharts.com. |
| |
| However, the monthly chart of QQQQ (Figure 2) is much more promising and encouraging. The current turbulence is likely to complete an inverted head & shoulder -- a bullish reversal formation. We can see the 50-day MA support at 41 levels, and therefore, the ongoing bearish rally is likely to halt near this technical support. The left shoulder and head has already been constructed, the upward price action from 50-day MA support would have formed a right shoulder, completing the major bullish reversal formation with neckline resistance at 50 levels. The RSI (14) is also ready to form the same pattern (purple box). The MACD (12,26,9) has turned positive and the ADX is indicating tight consolidation. Thus, the right shoulder formation is under way. |
| After the bullish breakout of the pattern, QQQQ would meet an estimated target of 50 - 25 = 25 + 50 = 75. Thus, the long-term perspectives of QQQQ are very bullish. However, the buy setup can be considered once the breakout is confirmed. To trade in current circumstances, we can enter short with the near-term target of $44 and $41 is estimated level for longer-term traders. |
Active trader in the Indian stock markets since 2003 and a full-time writer. Trading is largely based upon technical analysis.
| Company: | Independent |
| Address: | C1/3 Parth Indraprasth Towers. Vastrapur |
| Ahmedabad, Guj 380015 | |
| E-mail address: | chaitalimohile@yahoo.co.in |
Traders' Resource Links | |
| Independent has not added any product or service information to TRADERS' RESOURCE. | |
Click here for more information about our publications!
PRINT THIS ARTICLE

Request Information From Our Sponsors
- StockCharts.com, Inc.
- Candle Patterns
- Candlestick Charting Explained
- Intermarket Technical Analysis
- John Murphy on Chart Analysis
- John Murphy's Chart Pattern Recognition
- John Murphy's Market Message
- MurphyExplainsMarketAnalysis-Intermarket Analysis
- MurphyExplainsMarketAnalysis-Visual Analysis
- StockCharts.com
- Technical Analysis of the Financial Markets
- The Visual Investor
- VectorVest, Inc.
- Executive Premier Workshop
- One-Day Options Course
- OptionsPro
- Retirement Income Workshop
- Sure-Fire Trading Systems (VectorVest, Inc.)
- Trading as a Business Workshop
- VectorVest 7 EOD
- VectorVest 7 RealTime/IntraDay
- VectorVest AutoTester
- VectorVest Educational Services
- VectorVest OnLine
- VectorVest Options Analyzer
- VectorVest ProGraphics v6.0
- VectorVest ProTrader 7
- VectorVest RealTime Derby Tool
- VectorVest Simulator
- VectorVest Variator
- VectorVest Watchdog
