HOT TOPICS LIST
- MACD
- Fibonacci
- RSI
- Gann
- ADXR
- Stochastics
- Volume
- Triangles
- Futures
- Cycles
- Volatility
- ZIGZAG
- MESA
- Retracement
- Aroon
INDICATORS LIST
LIST OF TOPICS
PRINT THIS ARTICLE
by Koos van der Merwe
The Chicago Board Options Exchange Volatility Index, a popular measure of the implied volatility of S&P 500 index options, has something to say.
Position: Buy
Koos van der Merwe
Has been a technical analyst since 1969, and has worked as a futures and options trader with First Financial Futures in Johannesburg, South Africa.
PRINT THIS ARTICLE
Invert The VIX And Then Compare
06/23/10 11:45:31 AMby Koos van der Merwe
The Chicago Board Options Exchange Volatility Index, a popular measure of the implied volatility of S&P 500 index options, has something to say.
Position: Buy
| The Chicago Board Options Exchange Volatility Index (VIX) is not backed by anything. Followers of the VIX believe that positions held are merely a prediction of what they think could occur in the future. A high value corresponds to a more volatile market and therefore more costly options, which can be used to defray risk from this volatility by selling options. Often referred to as the fear index, the VIX represents one measure of the market's expectation of volatility over the next 30-day period. Many investors use the VIX as an indication of what is happening to the stock market and base their trading on the direction of the VIX. An inverted VIX therefore should by all accounts be an accurate guide and a picture as to market direction. What is the VIX telling us at the moment? |

|
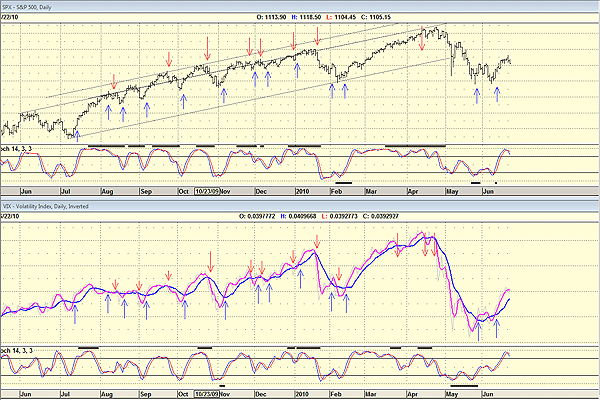
| FIGURE 1: S&P 500 AND INVERTED VIX WITH BUY/SELL SIGNALS |
| Graphic provided by: AdvancedGET. |
| |
| Figure 1 is a daily chart of the Standard & Poor's 500 and an inverted chart of the VIX. Note that the upper chart is the S&P 500 showing buy and sell signals. The horizontal lines drawn are drawn at random levels, and give an indication when a major signal is due to occur. Minor signals are simply a change of direction as shown by a number of the red arrows. |

|
| FIGURE 2: S&P 500 AND VIX WITH MOVING AVERAGES |
| Graphic provided by: AdvancedGET. |
| |
| Figure 2 is also a daily chart of the S&P 500 and an inverted chart of the VIX, but here I have colored the VIX line gray to make it unseen, and charted two moving averages, a three-period simple moving average, (maroon) and a 10-period simple moving average (blue) both of the close. My buy/sell triggers are where they cross. Note that there is a delay in the buy/sell signals when compared to Figure 1. Note too that the horizontal lines have been removed to make the analysis of the signals more obvious. There is no doubt that watching the VIX can be an indication of whether to buy or sell the index now, but it simply does not give an indication of the future trend in the market. The volatility shown by the VIX can be seen in the index, as it moves relative at the same speed as the VIX. Unfortunately, as my charts show, using the VIX as a forecasting tool -- a prediction of future trends -- simply cannot be done unless there is something I am not seeing. Placing a relative strength index (RSI) or a stochastic indicator on the VIX gives the same result as placing the indicator on the index as shown where I have included a 14-period stochastic. I do believe, however, that the VIX can be used effectively as a daytrading indicator. |
Has been a technical analyst since 1969, and has worked as a futures and options trader with First Financial Futures in Johannesburg, South Africa.
| Address: | 3256 West 24th Ave |
| Vancouver, BC | |
| Phone # for sales: | 6042634214 |
| E-mail address: | petroosp@gmail.com |
Click here for more information about our publications!
Comments

|

Request Information From Our Sponsors
- VectorVest, Inc.
- Executive Premier Workshop
- One-Day Options Course
- OptionsPro
- Retirement Income Workshop
- Sure-Fire Trading Systems (VectorVest, Inc.)
- Trading as a Business Workshop
- VectorVest 7 EOD
- VectorVest 7 RealTime/IntraDay
- VectorVest AutoTester
- VectorVest Educational Services
- VectorVest OnLine
- VectorVest Options Analyzer
- VectorVest ProGraphics v6.0
- VectorVest ProTrader 7
- VectorVest RealTime Derby Tool
- VectorVest Simulator
- VectorVest Variator
- VectorVest Watchdog
- StockCharts.com, Inc.
- Candle Patterns
- Candlestick Charting Explained
- Intermarket Technical Analysis
- John Murphy on Chart Analysis
- John Murphy's Chart Pattern Recognition
- John Murphy's Market Message
- MurphyExplainsMarketAnalysis-Intermarket Analysis
- MurphyExplainsMarketAnalysis-Visual Analysis
- StockCharts.com
- Technical Analysis of the Financial Markets
- The Visual Investor
