HOT TOPICS LIST
- MACD
- Fibonacci
- RSI
- Gann
- ADXR
- Stochastics
- Volume
- Triangles
- Futures
- Cycles
- Volatility
- ZIGZAG
- MESA
- Retracement
- Aroon
INDICATORS LIST
LIST OF TOPICS
PRINT THIS ARTICLE
by Austin Passamonte
Here's the midterm price view of the soybean futures market.
Position: N/A
Austin Passamonte
Austin is a private trader who trades emini stock index futures intraday. He currently trades various futures markets from home in addition to managing a trader's educational forum
PRINT THIS ARTICLE
TECHNICAL ANALYSIS
Summertime Soy
06/23/10 07:50:06 AMby Austin Passamonte
Here's the midterm price view of the soybean futures market.
Position: N/A
| The old crop is fading while the new crop is growing. Weather conditions are in play. Production acreage, bushels per acre yield and all the fundamental factors are in full force. This is a time when grains become volatile — more so than usual, depending on weather in the grain belts. |

|
| FIGURE 1: SOYBEAN FUTURES, WEEKLY |
| Graphic provided by: TradeStation. |
| |
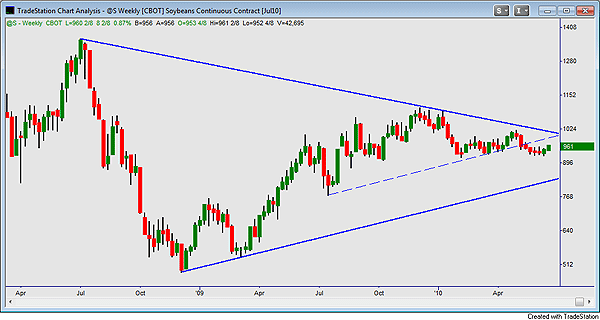
| Figure 1, the weekly chart view of soybean futures, shows a long-term wedge building pressure toward the front third of this two-year pattern. A smaller trendline of support (dashed blue, Figure 2) has recently given way as prior support now presumes future resistance. From here, it needs to climb back above that layer and continue on higher through the 1020s if an upside breakout is in the cards. |

|
| FIGURE 2: SOYBEAN FUTURES, WEEKLY |
| Graphic provided by: TradeStation. |
| |
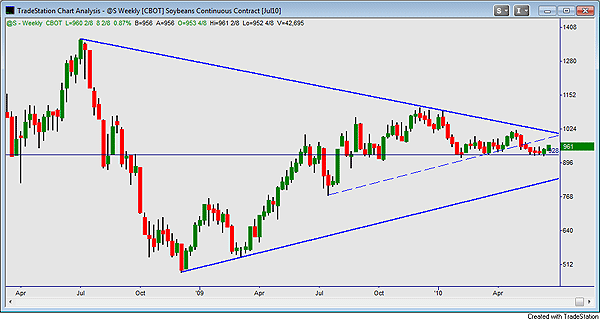
| Adding a horizontal trendline marking price magnetism, we can see where the 920s zone has been pivotal on both sides of the equation since at least April 2008. There have been a few swings above and below since then. Soybean futures have spent the past four weeks at that critical magnet. Recent open and close above has the market waiting until the next levels are resolved. |

|
| FIGURE 3: SOYBEAN FUTURES, DAILY |
| Graphic provided by: TradeStation. |
| |
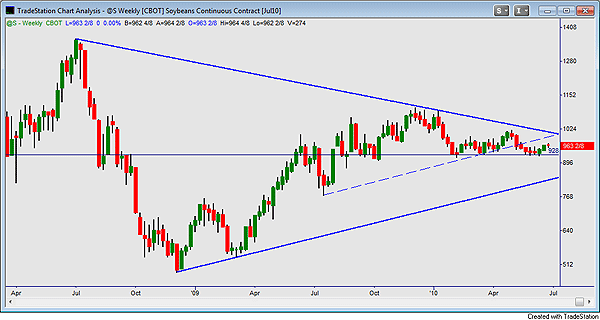
| Dialing into the daily-chart view (Figure 3) shows recent sideways consolidation from mid-May onward has rolled through an expanding "megaphone" pattern of instability. The higher high/lower low expansion of consolidation has expended energy instead of storing it in coiled fashion. This particular pattern usually (but not always) resolves with a downside break. Closes above the upper trendline could negate that, but this remains a weak to bearish price pattern until the market has clearly proven otherwise. |
Austin is a private trader who trades emini stock index futures intraday. He currently trades various futures markets from home in addition to managing a trader's educational forum
| Title: | Individual Trader |
| Company: | CoiledMarkets.com |
| Address: | PO Box 633 |
| Naples, NY 14512 | |
| Website: | coiledmarkets.com/blog |
| E-mail address: | austinp44@yahoo.com |
Traders' Resource Links | |
| CoiledMarkets.com has not added any product or service information to TRADERS' RESOURCE. | |
Click here for more information about our publications!
PRINT THIS ARTICLE

Request Information From Our Sponsors
- VectorVest, Inc.
- Executive Premier Workshop
- One-Day Options Course
- OptionsPro
- Retirement Income Workshop
- Sure-Fire Trading Systems (VectorVest, Inc.)
- Trading as a Business Workshop
- VectorVest 7 EOD
- VectorVest 7 RealTime/IntraDay
- VectorVest AutoTester
- VectorVest Educational Services
- VectorVest OnLine
- VectorVest Options Analyzer
- VectorVest ProGraphics v6.0
- VectorVest ProTrader 7
- VectorVest RealTime Derby Tool
- VectorVest Simulator
- VectorVest Variator
- VectorVest Watchdog
- StockCharts.com, Inc.
- Candle Patterns
- Candlestick Charting Explained
- Intermarket Technical Analysis
- John Murphy on Chart Analysis
- John Murphy's Chart Pattern Recognition
- John Murphy's Market Message
- MurphyExplainsMarketAnalysis-Intermarket Analysis
- MurphyExplainsMarketAnalysis-Visual Analysis
- StockCharts.com
- Technical Analysis of the Financial Markets
- The Visual Investor
