HOT TOPICS LIST
- MACD
- Fibonacci
- RSI
- Gann
- ADXR
- Stochastics
- Volume
- Triangles
- Futures
- Cycles
- Volatility
- ZIGZAG
- MESA
- Retracement
- Aroon
INDICATORS LIST
LIST OF TOPICS
PRINT THIS ARTICLE
by Austin Passamonte
Here's the midterm outlook for the Russell 2000 stock index market.
Position: N/A
Austin Passamonte
Austin is a private trader who trades emini stock index futures intraday. He currently trades various futures markets from home in addition to managing a trader's educational forum
PRINT THIS ARTICLE
TECHNICAL ANALYSIS
In A Rut
06/22/10 12:47:54 PMby Austin Passamonte
Here's the midterm outlook for the Russell 2000 stock index market.
Position: N/A
| The Russell 2000 small-cap index (RUT) has been a broad market leader since the tech-wreck days of 2000, when the semiconductor index passed that leadership baton. RUT is now where the "hot money" flows -- a proxy indication of what comes next in the market. |

|
| FIGURE 1: RUT, WEEKLY |
| Graphic provided by: TradeStation. |
| |
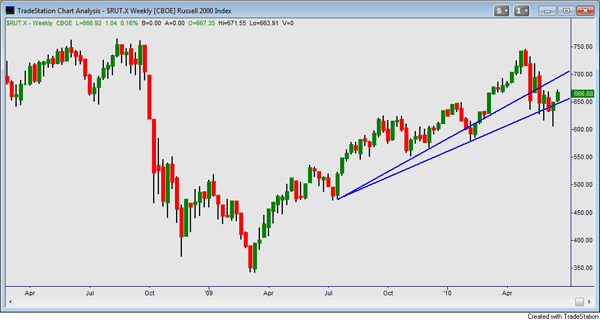
| The weekly chart view of RUT (Figure 1) shows two ascending trendlines since the July 2009 pullback lows to higher subsequent lows through the months that followed. Whenever you have two trendlines near one another, a sequential break through each usually projects a pending trend change ahead. In this case, the upper line has broken for a second time, and the lower line currently struggles to contain support right now. |

|
| FIGURE 2: RUT, WEEKLY |
| Graphic provided by: TradeStation. |
| |
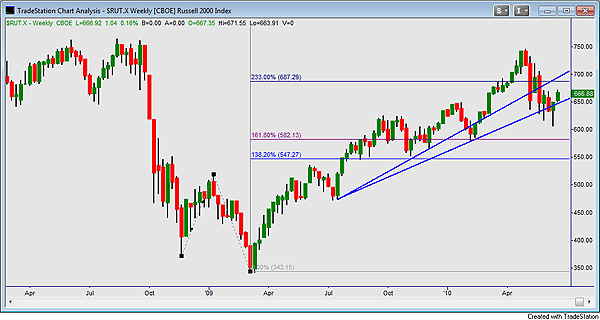
| Adding a 1-2-3 Fib projection measure to the mix, we see where price paused at the lower relative magnets before peaking above 233% and retracing back down. That 582 zone below should be at least one layer of support if tested again. See Figure 2. |

|
| FIGURE 3: RUT, WEEKLY |
| Graphic provided by: TradeStation. |
| |
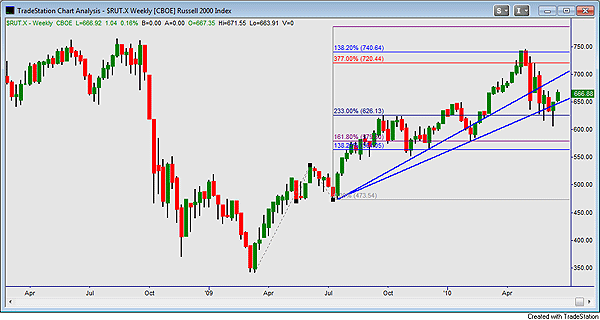
| Adding a second 1-2-3 projected bracket off an entirely different swing series shows overlapped values in two areas: 720-740 highs (peaked) and 560s to 580s congestion below. Here's a second layer of price magnetism that should offer support once again. See Figure 3. |

|
| FIGURE 4: RUT, WEEKLY |
| Graphic provided by: TradeStation. |
| |
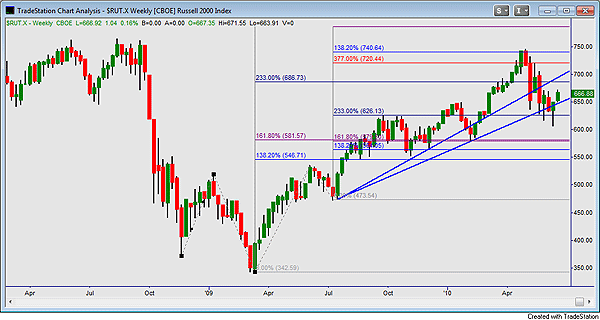
| If we measure off an earlier 1-2-3 swing in wider-range fashion, look what shows up near the 580 zone again -- yet another Fibonacci projection line, no fewer than three separate layers down there (Figure 4). These projected magnets come from totally different high-low swing series and are viewed by three (or more) totally different groups of traders making similar decisions for the same reasons. That's the type of fundamental behavior that creates the essence of resistance and support. It appears to be that RUT will find willing hands to prop or pause price action into any continued decline down there. |
Austin is a private trader who trades emini stock index futures intraday. He currently trades various futures markets from home in addition to managing a trader's educational forum
| Title: | Individual Trader |
| Company: | CoiledMarkets.com |
| Address: | PO Box 633 |
| Naples, NY 14512 | |
| Website: | coiledmarkets.com/blog |
| E-mail address: | austinp44@yahoo.com |
Traders' Resource Links | |
| CoiledMarkets.com has not added any product or service information to TRADERS' RESOURCE. | |
Click here for more information about our publications!
Comments
Date: 06/22/10Rank: 1Comment:

Request Information From Our Sponsors
- StockCharts.com, Inc.
- Candle Patterns
- Candlestick Charting Explained
- Intermarket Technical Analysis
- John Murphy on Chart Analysis
- John Murphy's Chart Pattern Recognition
- John Murphy's Market Message
- MurphyExplainsMarketAnalysis-Intermarket Analysis
- MurphyExplainsMarketAnalysis-Visual Analysis
- StockCharts.com
- Technical Analysis of the Financial Markets
- The Visual Investor
- VectorVest, Inc.
- Executive Premier Workshop
- One-Day Options Course
- OptionsPro
- Retirement Income Workshop
- Sure-Fire Trading Systems (VectorVest, Inc.)
- Trading as a Business Workshop
- VectorVest 7 EOD
- VectorVest 7 RealTime/IntraDay
- VectorVest AutoTester
- VectorVest Educational Services
- VectorVest OnLine
- VectorVest Options Analyzer
- VectorVest ProGraphics v6.0
- VectorVest ProTrader 7
- VectorVest RealTime Derby Tool
- VectorVest Simulator
- VectorVest Variator
- VectorVest Watchdog
