HOT TOPICS LIST
- MACD
- Fibonacci
- RSI
- Gann
- ADXR
- Stochastics
- Volume
- Triangles
- Futures
- Cycles
- Volatility
- ZIGZAG
- MESA
- Retracement
- Aroon
INDICATORS LIST
LIST OF TOPICS
PRINT THIS ARTICLE
by Chaitali Mohile
The S&P 500 is stuck between support and resistance.
Position: N/A
Chaitali Mohile
Active trader in the Indian stock markets since 2003 and a full-time writer. Trading is largely based upon technical analysis.
PRINT THIS ARTICLE
FIBONACCI
S&P 500 At Resistance
06/22/10 12:44:23 PMby Chaitali Mohile
The S&P 500 is stuck between support and resistance.
Position: N/A
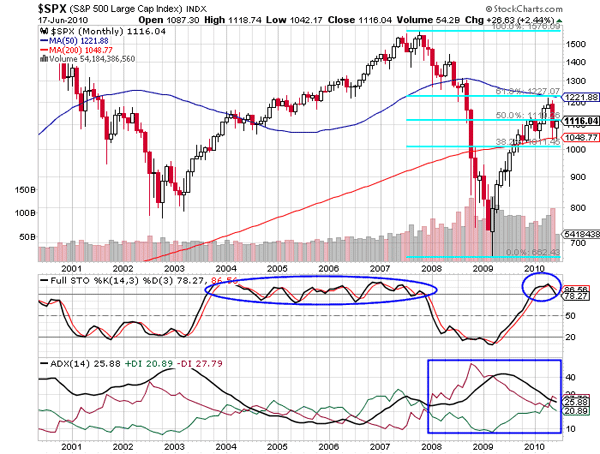
| An oversold stochastic (14,3,3) and descending average directional movement index (ADX) (14) initiated a trend reversal rally for the S&P 500 Large Cap Index ($SPX). The price chart of $SPX shows a bullish candle with long upper and lower shadows but does not wrap the previous bearish candle. The long upper and lower shadows suggest lack of confidence among traders. This shows that $SPX surged with the support of the two indicators. Gradually, the rally gained strength and converted the major long-term 200-day moving average resistance to support. After breaching the 200-day MA resistance, $SPX rushed to its next resistance, which is the 50-day moving average. The pullback offered attractive trading opportunities at various levels. Fresh demand poured in as the 200-day MA turned to support. We can see a tremendous rise in volume in Figure 1. |

|
| FIGURE 1: $SPX, MONTHLY |
| Graphic provided by: StockCharts.com. |
| |
| The journey between the two moving averages was safe and happening for long traders. However, the overbought stochastic and shooting star candlestick pattern in Figure 1 generated uncertainty and reluctance. On these notes, $SPX retraced to the 200-day MA support in May 2010. Currently, the index is unable to move above the level of 1120/25. The Fibonacci retracement tool helps identify support and resistance for the rallies in either direction. In Figure 1, $SPX faces the 50% Fibonacci retracement resistance at 1119.6 levels. As a result, the index is unable to surge toward the 50-day MA resistance. The 61% retracement level and the 50-day MA together make the 1221 levels stronger resistance and the next important target of the pullback rally. |
| The stochastic oscillator is ready to plunge below the 70 levels, and the ADX (14) is reflecting the developing downtrend. This signifies that $SPX would continue to remain under the pressure of 50% and 38.2% Fibonacci support-resistance levels. The indicators have to turn bullish to breach the 50% Fibonacci retracement resistance. Thus, $SPX is likely move in a tight range of 50% and 38.2% levels. |
Active trader in the Indian stock markets since 2003 and a full-time writer. Trading is largely based upon technical analysis.
| Company: | Independent |
| Address: | C1/3 Parth Indraprasth Towers. Vastrapur |
| Ahmedabad, Guj 380015 | |
| E-mail address: | chaitalimohile@yahoo.co.in |
Traders' Resource Links | |
| Independent has not added any product or service information to TRADERS' RESOURCE. | |
Click here for more information about our publications!
PRINT THIS ARTICLE

Request Information From Our Sponsors
- StockCharts.com, Inc.
- Candle Patterns
- Candlestick Charting Explained
- Intermarket Technical Analysis
- John Murphy on Chart Analysis
- John Murphy's Chart Pattern Recognition
- John Murphy's Market Message
- MurphyExplainsMarketAnalysis-Intermarket Analysis
- MurphyExplainsMarketAnalysis-Visual Analysis
- StockCharts.com
- Technical Analysis of the Financial Markets
- The Visual Investor
- VectorVest, Inc.
- Executive Premier Workshop
- One-Day Options Course
- OptionsPro
- Retirement Income Workshop
- Sure-Fire Trading Systems (VectorVest, Inc.)
- Trading as a Business Workshop
- VectorVest 7 EOD
- VectorVest 7 RealTime/IntraDay
- VectorVest AutoTester
- VectorVest Educational Services
- VectorVest OnLine
- VectorVest Options Analyzer
- VectorVest ProGraphics v6.0
- VectorVest ProTrader 7
- VectorVest RealTime Derby Tool
- VectorVest Simulator
- VectorVest Variator
- VectorVest Watchdog
