HOT TOPICS LIST
- MACD
- Fibonacci
- RSI
- Gann
- ADXR
- Stochastics
- Volume
- Triangles
- Futures
- Cycles
- Volatility
- ZIGZAG
- MESA
- Retracement
- Aroon
INDICATORS LIST
LIST OF TOPICS
PRINT THIS ARTICLE
by Austin Passamonte
Here's the midterm outlook for the US Dollar Index.
Position: N/A
Austin Passamonte
Austin is a private trader who trades emini stock index futures intraday. He currently trades various futures markets from home in addition to managing a trader's educational forum
PRINT THIS ARTICLE
TECHNICAL ANALYSIS
Half A Dollar For The DX
06/21/10 02:03:49 PMby Austin Passamonte
Here's the midterm outlook for the US Dollar Index.
Position: N/A
| In spite of all else, the US dollar holds the top currency reserve status until something monumental changes in the world. Global history tells us that no society endures forever -- or at the very least, none has survived forever to date. For now, all we can do is watch the meandering valuations against a basket of other currencies for present fair value consideration. This blended measure is what constitutes the US Dollar Index (DX). |

|
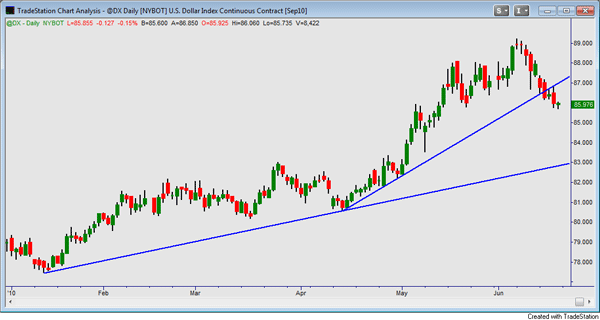
| FIGURE 1: DX, DAILY |
| Graphic provided by: TradeStation. |
| |
| The euro/dollar crisis, which bubbled to surface in early April, caused a brief, rapid, and extreme rally in the USD value versus a basket of other currencies. That ascending trendline in Figure 1, the daily chart, tracks the extremity of such ascent. On Tuesday, June 15, there was a break of that trendline. The rest of the week held closes below the projected support now presumed to be resistance. |
| The lower trendline projection from the 78 value range in January 2010 through a higher-low pullback in early April points toward the 83 area as the next probable support. If and when the DX pulls back to that price magnet, we should see a pause or reflexive bounce. Likewise, the distance from recent lows (77+) to highs (89+) or roughly 12 cents on the scale suggests a -50% retracement of that swing to be 89+ minus $0.06 = 83 zone. Two different technical measures project to the same valuation level as probable support (Figure 2). |

|
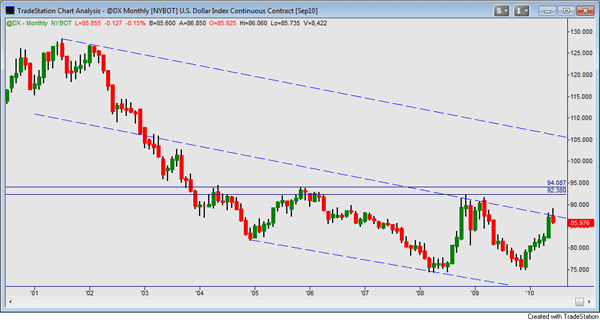
| FIGURE 2: DX, MONTHLY |
| Graphic provided by: TradeStation. |
| |
| Figure 2, the monthly chart, shows the big picture (adjusted contract) from 2001 decade highs near 130 through 2008 lows near the 75 zone. Connecting subsequent lower highs and lower lows creates a descending channel (blue dashed), the middle value of which has held swing highs the past two times, including the present. June 2010 opened at the midline value of this 10-year descending channel. It needs to close above that point for at least a couple of months before any sustained upside progress can be trusted. |
| If and when that midchannel value gives way, net stop in the congestion above would be the 92-94 area. So far this decade, a formidable triple-top zone of peak swing highs has been formed each time. Before the DX can mount any type of assault on long-term historical highs, it must first hit the base at the 95+ zone to expend all resistance. Until those things happen, the downward trek through these technical levels remains firmly intact. |
Austin is a private trader who trades emini stock index futures intraday. He currently trades various futures markets from home in addition to managing a trader's educational forum
| Title: | Individual Trader |
| Company: | CoiledMarkets.com |
| Address: | PO Box 633 |
| Naples, NY 14512 | |
| Website: | coiledmarkets.com/blog |
| E-mail address: | austinp44@yahoo.com |
Traders' Resource Links | |
| CoiledMarkets.com has not added any product or service information to TRADERS' RESOURCE. | |
Click here for more information about our publications!
Comments
Date: 06/21/10Rank: 3Comment:

Request Information From Our Sponsors
- StockCharts.com, Inc.
- Candle Patterns
- Candlestick Charting Explained
- Intermarket Technical Analysis
- John Murphy on Chart Analysis
- John Murphy's Chart Pattern Recognition
- John Murphy's Market Message
- MurphyExplainsMarketAnalysis-Intermarket Analysis
- MurphyExplainsMarketAnalysis-Visual Analysis
- StockCharts.com
- Technical Analysis of the Financial Markets
- The Visual Investor
- VectorVest, Inc.
- Executive Premier Workshop
- One-Day Options Course
- OptionsPro
- Retirement Income Workshop
- Sure-Fire Trading Systems (VectorVest, Inc.)
- Trading as a Business Workshop
- VectorVest 7 EOD
- VectorVest 7 RealTime/IntraDay
- VectorVest AutoTester
- VectorVest Educational Services
- VectorVest OnLine
- VectorVest Options Analyzer
- VectorVest ProGraphics v6.0
- VectorVest ProTrader 7
- VectorVest RealTime Derby Tool
- VectorVest Simulator
- VectorVest Variator
- VectorVest Watchdog
