HOT TOPICS LIST
- MACD
- Fibonacci
- RSI
- Gann
- ADXR
- Stochastics
- Volume
- Triangles
- Futures
- Cycles
- Volatility
- ZIGZAG
- MESA
- Retracement
- Aroon
INDICATORS LIST
LIST OF TOPICS
PRINT THIS ARTICLE
by Chaitali Mohile
The bullish breakout of Pharmaceutical Product Development is likely to increase demand for the stock.
Position: Buy
Chaitali Mohile
Active trader in the Indian stock markets since 2003 and a full-time writer. Trading is largely based upon technical analysis.
PRINT THIS ARTICLE
FLAGS AND PENNANTS
PPDI Regaining Strength
06/18/10 11:32:32 AMby Chaitali Mohile
The bullish breakout of Pharmaceutical Product Development is likely to increase demand for the stock.
Position: Buy
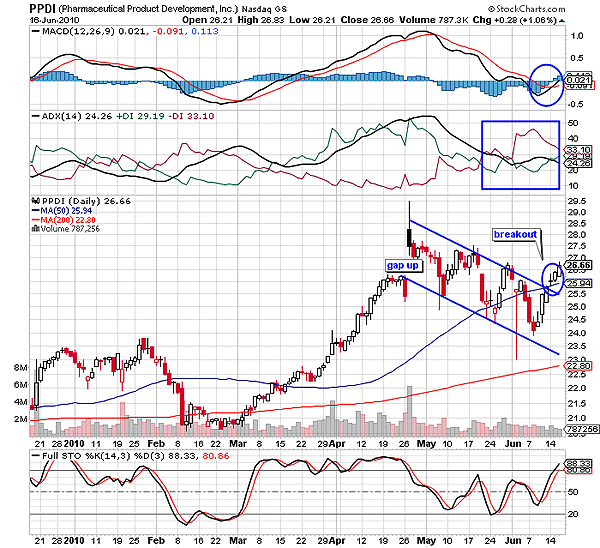
| After an exclusive advance rally, Pharmaceutical Product Development (PPDI) gapped up in April. Gap occurrence is unpredictable and a news-sensitive event. The gap up in Figure 1 took PPDI to an intermediate high, but the filled black candle that followed was not a convincing sight for buyers. The long upper shadow shows that the intraday close was below the day's high. Such a close is considered to be a bearish indication. In addition, an overheated uptrend indicated by the average directional movement index (ADX) (14) and an overbought stochastic (14,3,3) suggested the possibility of a new downside rally. PPDI did drop down a few points from an intermediate high, filling the gap formation. The downside rally formed a falling wedge or a bearish flag as seen in Figure 1. |
| During the flag formation, PPDI formed lower highs and lower lows. The long bearish candles in Figure 1 reflect the bearish forces as well as the short-selling becoming stronger with every declining peak. The declining uptrend strengthened the selling pressure on the downside rally of PPDI. This rally formed a bullish flag & pennant formation on the daily time frame in Figure 1. We can see that the pattern has already broken upward and established support at the 50-day moving average (MA), but low volume is a point of concern. Along with the MA support, the upper trendline of the flag is the support for the breakout rally. The moving average convergence/divergence (MACD) (12,26,9) (see the marked circle) is ready to surge in positive territory. The downtrend is declining, and the stochastic oscillator has moved in a bullish area above 50 levels. Therefore, the breakout is likely to sustain the 50-day MA support. |

|
| FIGURE 1: PPDI, DAILY. The bullish flag & pennant breakout has established support at the 50-day MA. |
| Graphic provided by: StockCharts.com. |
| |
| Hence, traders can consider triggering long positions above $27 with the target of 29.5 - 22.5 = 7 + 26 = 32. The rally from $27 toward the estimated target of $32 would bring handsome gains. However, the rally is likely to face resistance at the previous resistance of $29.5. |

|
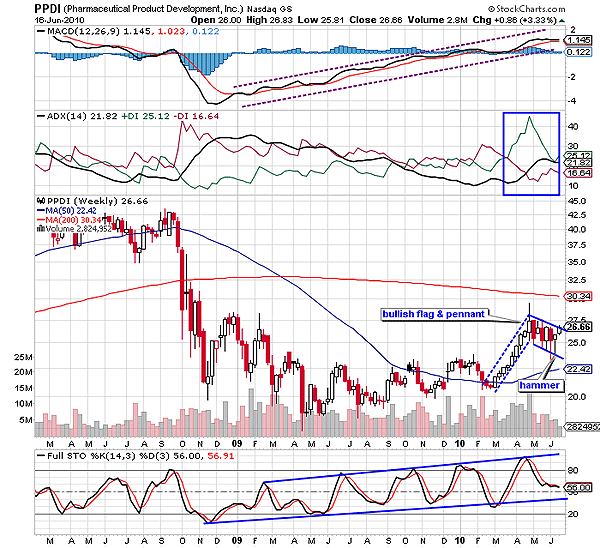
| FIGURE 2: PPDI, WEEKLY. After the breakout, the stock has the 200-day MA resistance. |
| Graphic provided by: StockCharts.com. |
| |
| The bullish flag & pennant formation has also appeared on the weekly time frame in Figure 2. Although this bullish continuation pattern is commonly found on the technical charts, when it is formed on two different time frames of a particular stock, the pattern becomes most reliable. Therefore, the formation in Figure 2 can be considered for trading after the confirmed breakout. The ADX (14) reflects a developing uptrend, the MACD (12,26,9) has steadily climbed the positive region, and the stochastic oscillator has bullish support of the center line at 50 levels. Thus, the breakout in Figure 2 is under way. The target of $32 remains the same, even for medium-term traders. Here, the rally has resistance of the 200-day MA, which coincides with the previous high resistance on the daily time frame. Therefore, PPDI is likely to undergo robust volatility near 29.5 and 30 levels. |
| To conclude, PPDI is a good stock to go long at $27 with a target of $32 and profit booking in the range of $29.5 or $30. |
Active trader in the Indian stock markets since 2003 and a full-time writer. Trading is largely based upon technical analysis.
| Company: | Independent |
| Address: | C1/3 Parth Indraprasth Towers. Vastrapur |
| Ahmedabad, Guj 380015 | |
| E-mail address: | chaitalimohile@yahoo.co.in |
Traders' Resource Links | |
| Independent has not added any product or service information to TRADERS' RESOURCE. | |
Click here for more information about our publications!
PRINT THIS ARTICLE

Request Information From Our Sponsors
- StockCharts.com, Inc.
- Candle Patterns
- Candlestick Charting Explained
- Intermarket Technical Analysis
- John Murphy on Chart Analysis
- John Murphy's Chart Pattern Recognition
- John Murphy's Market Message
- MurphyExplainsMarketAnalysis-Intermarket Analysis
- MurphyExplainsMarketAnalysis-Visual Analysis
- StockCharts.com
- Technical Analysis of the Financial Markets
- The Visual Investor
- VectorVest, Inc.
- Executive Premier Workshop
- One-Day Options Course
- OptionsPro
- Retirement Income Workshop
- Sure-Fire Trading Systems (VectorVest, Inc.)
- Trading as a Business Workshop
- VectorVest 7 EOD
- VectorVest 7 RealTime/IntraDay
- VectorVest AutoTester
- VectorVest Educational Services
- VectorVest OnLine
- VectorVest Options Analyzer
- VectorVest ProGraphics v6.0
- VectorVest ProTrader 7
- VectorVest RealTime Derby Tool
- VectorVest Simulator
- VectorVest Variator
- VectorVest Watchdog
