HOT TOPICS LIST
- MACD
- Fibonacci
- RSI
- Gann
- ADXR
- Stochastics
- Volume
- Triangles
- Futures
- Cycles
- Volatility
- ZIGZAG
- MESA
- Retracement
- Aroon
INDICATORS LIST
LIST OF TOPICS
PRINT THIS ARTICLE
by Chaitali Mohile
The pullback rally of the Financial Sector SPDR has moved closer to the moving average resistance. The technical check is necessary for the direction of the breakout.
Position: Buy
Chaitali Mohile
Active trader in the Indian stock markets since 2003 and a full-time writer. Trading is largely based upon technical analysis.
PRINT THIS ARTICLE
TECHNICAL INDICATORS
Is The Financial Sector Ready To Break Out?
06/17/10 12:44:13 PMby Chaitali Mohile
The pullback rally of the Financial Sector SPDR has moved closer to the moving average resistance. The technical check is necessary for the direction of the breakout.
Position: Buy
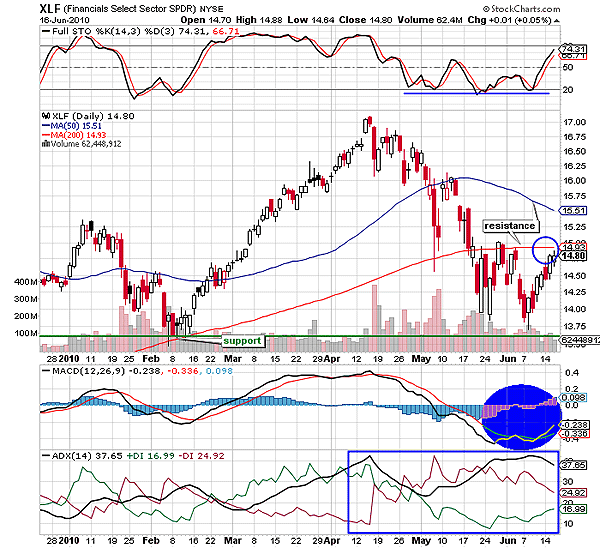
| Recently, the corrective rally of the Financial Select Sector SPDR (XLF) has challenged the previous low at 13.50 levels. The rally reversed the intermediate uptrend and generated huge bearish pressure in the sector. The bullish momentum indicated by the moving average convergence/divergence (MACD) (12,26,9) twisted as the indicator underwent a bearish crossover in positive territory. Gradually, the negative MACD (12,26,9) slipped below the zero line, suggesting a weak momentum. In addition, an overbought full stochastic (14,3,3) plunged to an extreme bearish zone near 20 levels. Thus, everything together dragged off XLF from the higher levels of 17. In this process, the 50-day and 200-day moving average (MA) support was converted to resistance. |

|
| FIGURE 1: XLF, DAILY |
| Graphic provided by: StockCharts.com. |
| |
| In Figure 1, we can see that XLF suffered volatile sessions below the newly formed resistance. The developing downtrend reached an overheated region. The average directional movement index (ADX)(14) hit the 40 levels, indicating the possibility of a trend reversal. After testing and retesting the 200-day MA resistance, the sector is ready to break out. Does it have the support of the indicators? The stochastic oscillator surged from 20 levels, the ADX (14) tipped down from the overheated downtrend levels, and the MACD (12,26,9) showed a bullish crossover (see the blue circle) in negative territory. Therefore, XLF is boosted with the bullish strength to breach the 200-day MA resistance. In addition, the previous low at 13.50 levels is likely to extend robust support for the ongoing bullish rally. Yet we need to wait for the confirmed breakout before initiating any long positions. |

|
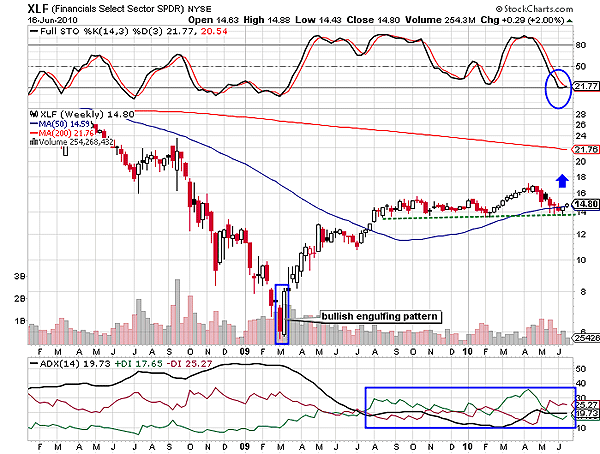
| FIGURE 2: XLF, WEEKLY |
| Graphic provided by: StockCharts.com. |
| |
| A bullish engulfing candlestick pattern on the weekly time frame reversed the previous correction. Figure 2 shows that the new rally that was initiated in March 2009 established support near 14 to 13.75 levels. Thereafter, XLF moved with the support line. Currently, the sector index fluctuated near the support-resistance of the 50-day MA. The stochastic is likely to surge from the oversold region, reflecting fresh buying opportunities. However, the ADX (14) is suggesting a shaky trend. Therefore, the breakout journey is likely to be sluggish. In such a situation, traders should keep an eye on short-term trading opportunities. |
| Considering the technical charts on both time frames, XLF is very likely to break out in a bullish direction but at a relatively slow pace. |
Active trader in the Indian stock markets since 2003 and a full-time writer. Trading is largely based upon technical analysis.
| Company: | Independent |
| Address: | C1/3 Parth Indraprasth Towers. Vastrapur |
| Ahmedabad, Guj 380015 | |
| E-mail address: | chaitalimohile@yahoo.co.in |
Traders' Resource Links | |
| Independent has not added any product or service information to TRADERS' RESOURCE. | |
Click here for more information about our publications!
PRINT THIS ARTICLE

Request Information From Our Sponsors
- StockCharts.com, Inc.
- Candle Patterns
- Candlestick Charting Explained
- Intermarket Technical Analysis
- John Murphy on Chart Analysis
- John Murphy's Chart Pattern Recognition
- John Murphy's Market Message
- MurphyExplainsMarketAnalysis-Intermarket Analysis
- MurphyExplainsMarketAnalysis-Visual Analysis
- StockCharts.com
- Technical Analysis of the Financial Markets
- The Visual Investor
- VectorVest, Inc.
- Executive Premier Workshop
- One-Day Options Course
- OptionsPro
- Retirement Income Workshop
- Sure-Fire Trading Systems (VectorVest, Inc.)
- Trading as a Business Workshop
- VectorVest 7 EOD
- VectorVest 7 RealTime/IntraDay
- VectorVest AutoTester
- VectorVest Educational Services
- VectorVest OnLine
- VectorVest Options Analyzer
- VectorVest ProGraphics v6.0
- VectorVest ProTrader 7
- VectorVest RealTime Derby Tool
- VectorVest Simulator
- VectorVest Variator
- VectorVest Watchdog
