HOT TOPICS LIST
- MACD
- Fibonacci
- RSI
- Gann
- ADXR
- Stochastics
- Volume
- Triangles
- Futures
- Cycles
- Volatility
- ZIGZAG
- MESA
- Retracement
- Aroon
INDICATORS LIST
LIST OF TOPICS
PRINT THIS ARTICLE
by Chaitali Mohile
After correcting 600 points, the French CAC 40 Index has been consolidating near support. Will the index recover or take another plunge?
Position: N/A
Chaitali Mohile
Active trader in the Indian stock markets since 2003 and a full-time writer. Trading is largely based upon technical analysis.
PRINT THIS ARTICLE
SUPPORT & RESISTANCE
Has The French Index Stabilized?
06/16/10 02:02:07 PMby Chaitali Mohile
After correcting 600 points, the French CAC 40 Index has been consolidating near support. Will the index recover or take another plunge?
Position: N/A
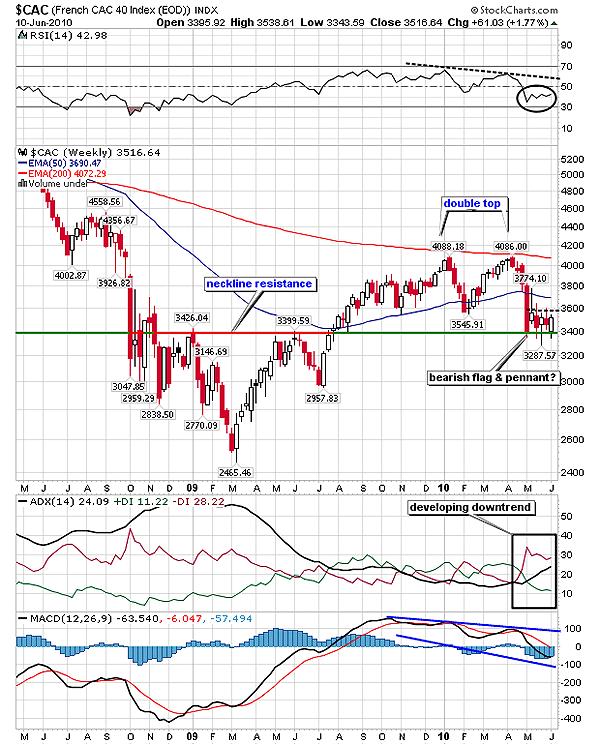
| The French CAC 40 Index ($CAC) formed a double top -- a bearish reversal formation under the resistance of the 200-day exponential moving average (EMA). The two peaks were formed at 4088-4086 levels. The relative strength index (RSI) (14) showed a negative divergence during the double-top formation, confirming the possibility of the trend reversal. We can see that the weak average directional movement index (ADX) (14) in Figure 1 surged above the 20 levels, indicating a developing downtrend. Thus, the bearish breakout of the double-top formation worsened and $CAC lost nearly 600 points from the top. |
| A neckline resistance of the previous inverted head & shoulders was the immediate technical support for $CAC. In the past few weeks, the index has been consolidating near neckline support. The support-resistance tool in Figure 1 shows the neckline resistance (red) is the current support (green) for the index. The RSI (14) is in a no-man's land between the 30 and 50 levels. The ADX (14 ) is indicating the developing downtrend at 24 levels, and the moving average convergence/divergence (MACD) (12,26,9) is plunging in negative territory below the zero line. Therefore, $CAC is likely to witness volatile consolidation. The 50-day exponential moving average (EMA) would suppress the bullish jump from the current support levels. These conditions make me suspicious about a bearish flag & pennant formation. |

|
| FIGURE 1: $CAC, WEEKLY. The index is resting with the neckline resistance converted to the support of the previous inverted head & shoulders formation. |
| Graphic provided by: StockCharts.com. |
| |
| $CAC is consolidating after the huge declining rally of 600 points and the downtrend is developing. Therefore, the conditions are very much favorable for the bearish flag & pennant continuation pattern to form. The pattern would get confirmed if $CAC breaks the support line. The breakdown would further damage the index by plunging to 2800-3400 (the breakout level) minus 600 (length of the flag pole). Traders need to stay alert. During consolidation, $CAC is likely to challenge the 50-day EMA, offering a short-term buying opportunity. |
Active trader in the Indian stock markets since 2003 and a full-time writer. Trading is largely based upon technical analysis.
| Company: | Independent |
| Address: | C1/3 Parth Indraprasth Towers. Vastrapur |
| Ahmedabad, Guj 380015 | |
| E-mail address: | chaitalimohile@yahoo.co.in |
Traders' Resource Links | |
| Independent has not added any product or service information to TRADERS' RESOURCE. | |
Click here for more information about our publications!
Comments

Request Information From Our Sponsors
- VectorVest, Inc.
- Executive Premier Workshop
- One-Day Options Course
- OptionsPro
- Retirement Income Workshop
- Sure-Fire Trading Systems (VectorVest, Inc.)
- Trading as a Business Workshop
- VectorVest 7 EOD
- VectorVest 7 RealTime/IntraDay
- VectorVest AutoTester
- VectorVest Educational Services
- VectorVest OnLine
- VectorVest Options Analyzer
- VectorVest ProGraphics v6.0
- VectorVest ProTrader 7
- VectorVest RealTime Derby Tool
- VectorVest Simulator
- VectorVest Variator
- VectorVest Watchdog
- StockCharts.com, Inc.
- Candle Patterns
- Candlestick Charting Explained
- Intermarket Technical Analysis
- John Murphy on Chart Analysis
- John Murphy's Chart Pattern Recognition
- John Murphy's Market Message
- MurphyExplainsMarketAnalysis-Intermarket Analysis
- MurphyExplainsMarketAnalysis-Visual Analysis
- StockCharts.com
- Technical Analysis of the Financial Markets
- The Visual Investor
