

HOT TOPICS LIST
- MACD
- Fibonacci
- RSI
- Gann
- ADXR
- Stochastics
- Volume
- Triangles
- Futures
- Cycles
- Volatility
- ZIGZAG
- MESA
- Retracement
- Aroon
INDICATORS LIST
LIST OF TOPICS
PRINT THIS ARTICLE
by Austin Passamonte
Here's the midterm price outlook for S&P 500.
Position: N/A
Austin Passamonte
Austin is a private trader who trades emini stock index futures intraday. He currently trades various futures markets from home in addition to managing a trader's educational forum
PRINT THIS ARTICLE
TECHNICAL ANALYSIS
Midterm Price Analysis of The S&P 500
06/15/10 11:27:34 AMby Austin Passamonte
Here's the midterm price outlook for S&P 500.
Position: N/A
| Stock index markets broke off their low-volume, low-volatility lurch upward in dramatic fashion. No surprise -- how many times did we say that one extreme of market behavior always resolves itself in equally opposite extremes? |
|
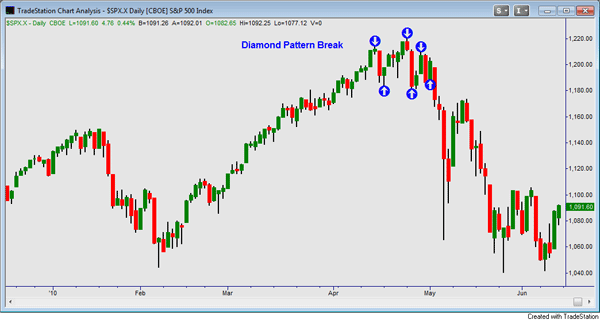
| FIGURE 1: S&P 500, DAILY |
| Graphic provided by: TradeStation. |
| |
| Stock index markets spent the first few weeks of April and May wedging themselves into diamond-top patterns (Figure 1). Peak -- higher peak -- lower peak with dip -- lower dip -- higher dip (blue arrows) broke bearish, like this pattern usually does. Sometimes, diamond patterns break abruptly upward in sharp resolution -- but usually not. This time around was just another occurrence where downside failure broke the sideways malaise. |
|
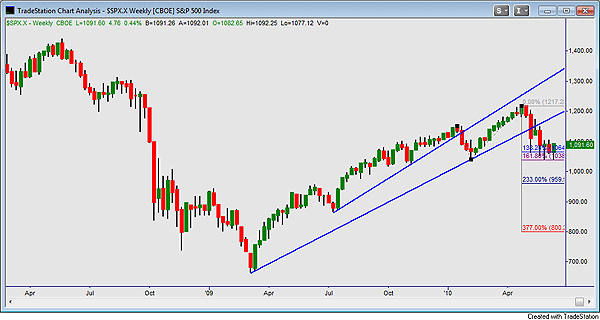
| FIGURE 2: S&P 500, WEEKLY |
| Graphic provided by: TradeStation. |
| |
| Diamond patterns merely show us where dry tinder piles up while awaiting the next errant spark. Dialing out to the weekly chart picture (Figure 2), we clearly see where two different long-term trendlines of support broke lower in markedly bearish fashion; a 1-2-3 swing measured down for potential price magnets below showed 1038 and 1064 levels as first objectives to be hit. If that were to continue, 959+ and then 800 are both measurable on the long-term horizon. |
|
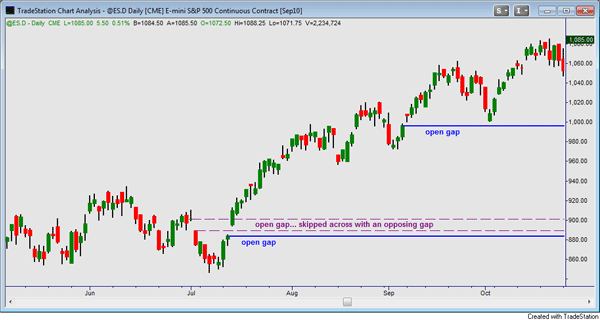
| FIGURE 3: S&P 500 FUTURES (ES), DAILY |
| Graphic provided by: TradeStation. |
| |
| It might take a while for lower objectives to resolve. First up (or down) is an existing open gap at the 998 zone of Standard & Poor's 500 futures (ES) (Figure 3). Way down near the 880 mark is another clean gap -- a classic breakway fashion back then, but now it's merely an open window to be closed later. Between those two is yet a third gap (purple dashed lines) that was not traded through and filled. It was traded into and outside of by an opposing gap headed the opposite direction. Three historical gaps below in the S&P 500 futures market remain historical tractor beams of influence on price. The nearer that today's market heads toward them, the stronger an influence or "pull" they will have. |
|
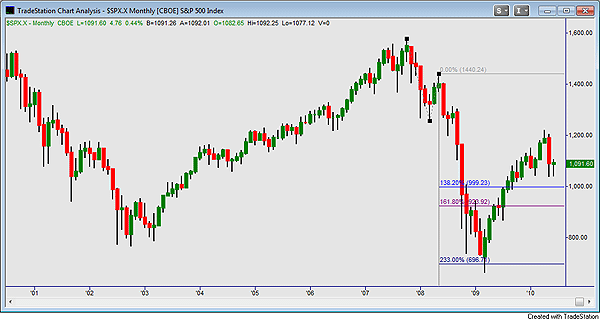
| FIGURE 4: S&P 500, MONTHLY |
| Graphic provided by: TradeStation. |
| |
| Last of all, a peek at the monthly chart (Figure 4) shows where long-term projections as measured at the time seemed all but impossible to fulfill. That's usually the case -- in the present, distant projections seem implausible if not nigh impossible to most. But such measured projections often have a way of completing their sequence to the utter amazement (and dismay) of those who doubt and disbelieve. When in doubt, objectively trust what price action has to say. |
Austin is a private trader who trades emini stock index futures intraday. He currently trades various futures markets from home in addition to managing a trader's educational forum
| Title: | Individual Trader |
| Company: | CoiledMarkets.com |
| Address: | PO Box 633 |
| Naples, NY 14512 | |
| Website: | coiledmarkets.com/blog |
| E-mail address: | austinp44@yahoo.com |
Traders' Resource Links | |
| CoiledMarkets.com has not added any product or service information to TRADERS' RESOURCE. | |
Click here for more information about our publications!
Comments
Date:�06/16/10Rank:�3Comment:�

Request Information From Our Sponsors
- StockCharts.com, Inc.
- Candle Patterns
- Candlestick Charting Explained
- Intermarket Technical Analysis
- John Murphy on Chart Analysis
- John Murphy's Chart Pattern Recognition
- John Murphy's Market Message
- MurphyExplainsMarketAnalysis-Intermarket Analysis
- MurphyExplainsMarketAnalysis-Visual Analysis
- StockCharts.com
- Technical Analysis of the Financial Markets
- The Visual Investor
- VectorVest, Inc.
- Executive Premier Workshop
- One-Day Options Course
- OptionsPro
- Retirement Income Workshop
- Sure-Fire Trading Systems (VectorVest, Inc.)
- Trading as a Business Workshop
- VectorVest 7 EOD
- VectorVest 7 RealTime/IntraDay
- VectorVest AutoTester
- VectorVest Educational Services
- VectorVest OnLine
- VectorVest Options Analyzer
- VectorVest ProGraphics v6.0
- VectorVest ProTrader 7
- VectorVest RealTime Derby Tool
- VectorVest Simulator
- VectorVest Variator
- VectorVest Watchdog